
Figure 7.
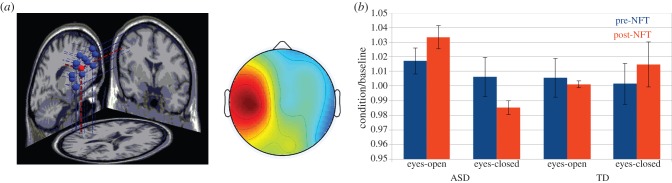
(a) Left: Mu component dipole sources, mean in red; right: mean scalp distribution of mu components. (b) Ratio of mu power for condition divided by baseline. (Online version in colour.)
Official websites use .gov
A
.gov website belongs to an official
government organization in the United States.
Secure .gov websites use HTTPS
A lock (
) or https:// means you've safely
connected to the .gov website. Share sensitive
information only on official, secure websites.
(a) Left: Mu component dipole sources, mean in red; right: mean scalp distribution of mu components. (b) Ratio of mu power for condition divided by baseline. (Online version in colour.)