
Figure 3.
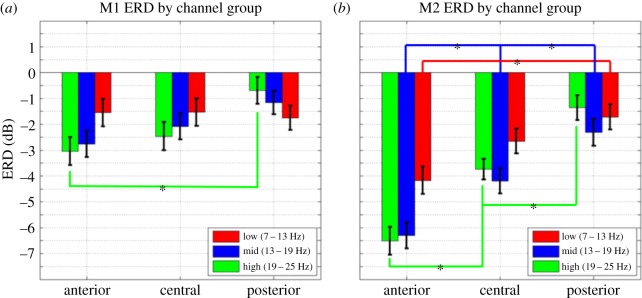
Mean ERD for the anterior, central and posterior groups of electrodes for (a) M1 and (b) M2. Only the three most sensitive frequency bands are shown. *p < 0.05, Tukey's HSD.
Official websites use .gov
A
.gov website belongs to an official
government organization in the United States.
Secure .gov websites use HTTPS
A lock (
) or https:// means you've safely
connected to the .gov website. Share sensitive
information only on official, secure websites.
Mean ERD for the anterior, central and posterior groups of electrodes for (a) M1 and (b) M2. Only the three most sensitive frequency bands are shown. *p < 0.05, Tukey's HSD.