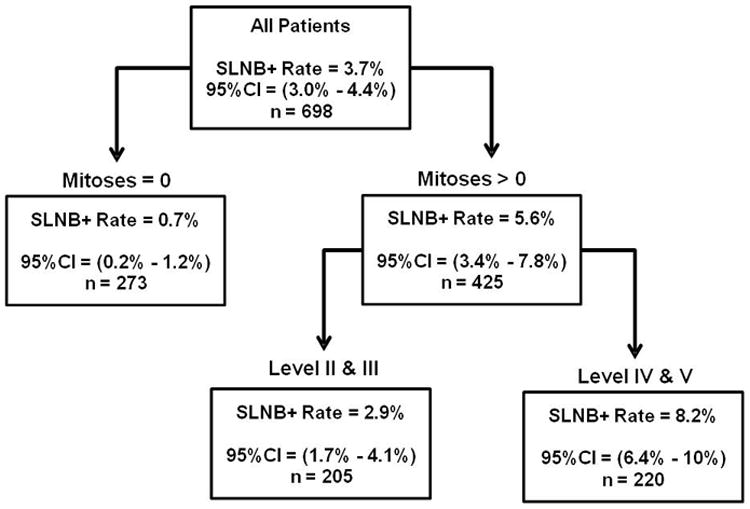
Figure 1. Sentinel Lymph Node Positivity Rates by Classification and Regression Tree Analysis.

The presence of mitoses defined the optimal primary cut-point for differentiating the rate of SLN positivity. In patients with mitogenic tumors, Clark level further differentiated tumors into high and low risk for a positive SLNB. Analysis included only patients where mitotic rate was known. CI (confidence interval).
