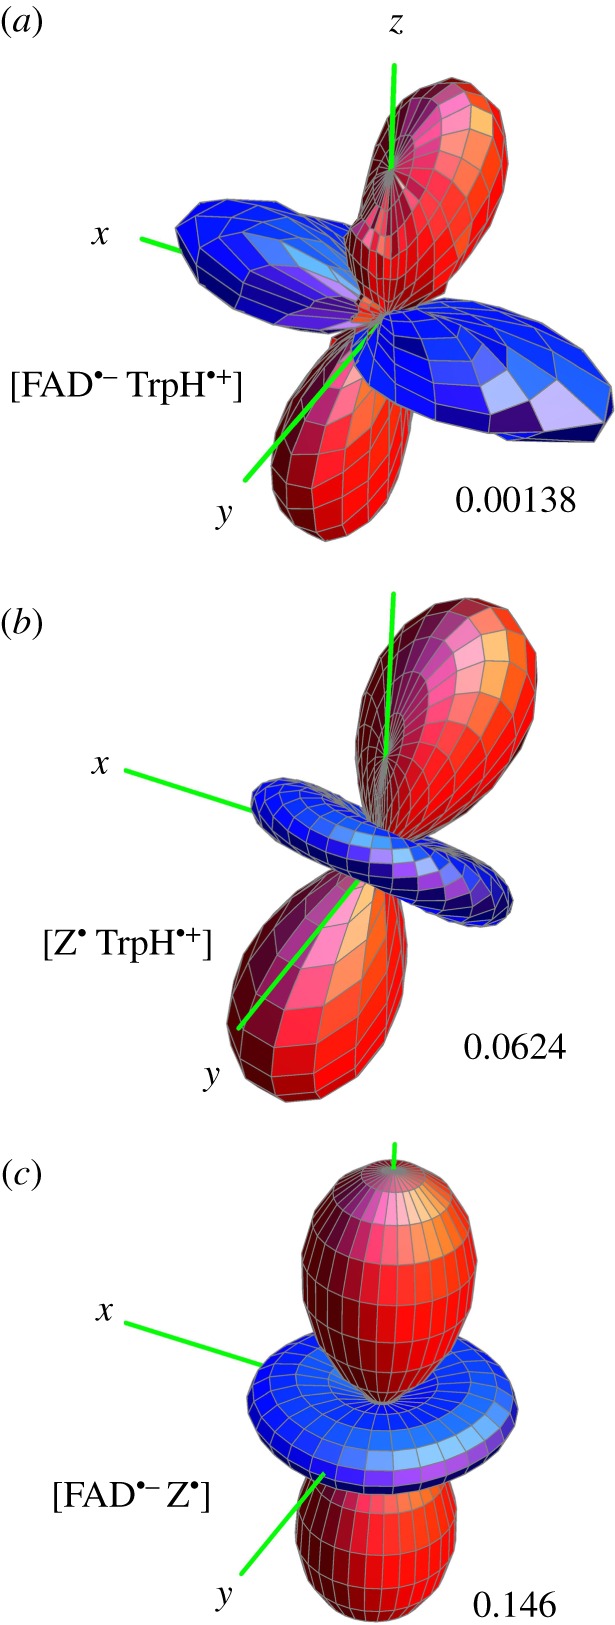
Figure 2.

Singlet yield anisotropy plots for the radical pairs (a) [FAD•− TrpH•+], (b) [Z• TrpH•+] and (c) [FAD•− Z•], where Z• is a radical with no hyperfine interactions. The spherical average of the reaction yield,  i.e. the part of ΦS that is independent of the magnetic field direction, has been subtracted to reveal the anisotropic component, which contains the directional information. The distance in any direction from the centre of the pattern to the surface is proportional to the value of
  when the magnetic field has that direction. Red/blue regions correspond to reaction yields larger/smaller than
  FAD•− and TrpH•+ each have the seven hyperfine interactions shown in figure 1. The values of ΔΦS for the three radical pairs are as shown. The three anisotropy patterns are not drawn to scale. The coordinate system is that of FAD•− (figure 1a). The orientation of TrpH•+ relative to FAD•− is as shown in figure 1. Details of the simulations are given in the electronic supplementary material.
