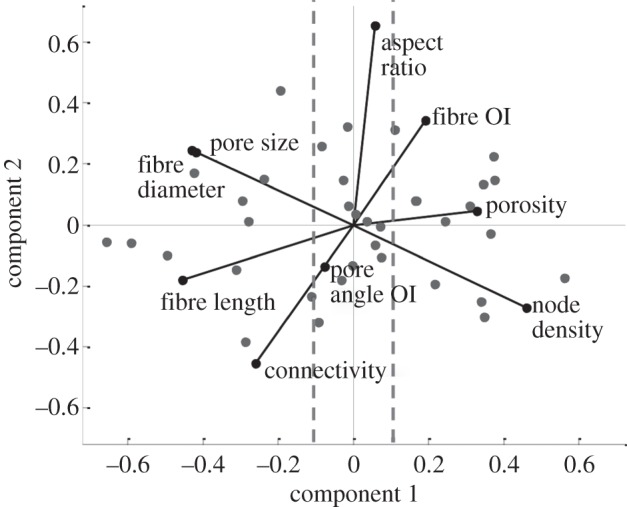
Figure 6.

Identified influential microstructural features. Biplot of the principal component analysis (PCA) of the feature space. Filled circles represent observations in the principal component space, whereas vectors indicate the contributions of each feature to the first (x-axis) and second (y-axis) principal component. OI denotes orientation index. Vertical dashed lines represent the 0.1 magnitude threshold value of the first principal component coefficients used to screen important features.
