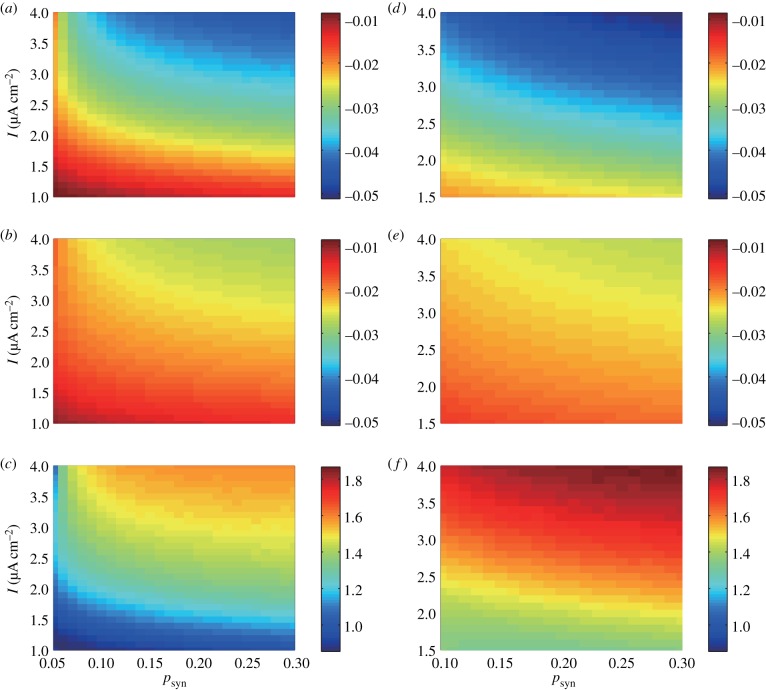
Figure 6.
(a,b) Δωr in (a) and Δωd in (b) with σ = 1. (d,e) Δωr in (d) and Δωd in (e) with σ = 2. (c,f) Ratio of the influence of changing synaptic time constant to gamma oscillation frequency (Δωr/Δωd). σ = 1 in (c) and σ = 2 in (f). The parameter regions are determined by referring to the bifurcation diagrams for macroscopic oscillatory region in figure 2a,d; therefore, 1 ≤ I ≤ 4 and 0.05 ≤ psyn ≤ 0.3 are adopted for (a–c), while 1.5 ≤ I ≤ 4 and 0.1 ≤ psyn ≤ 0.3 are for (d–f). Besides τr, τd, σ, psyn and I, parameters in this figure are set as nominal values.

