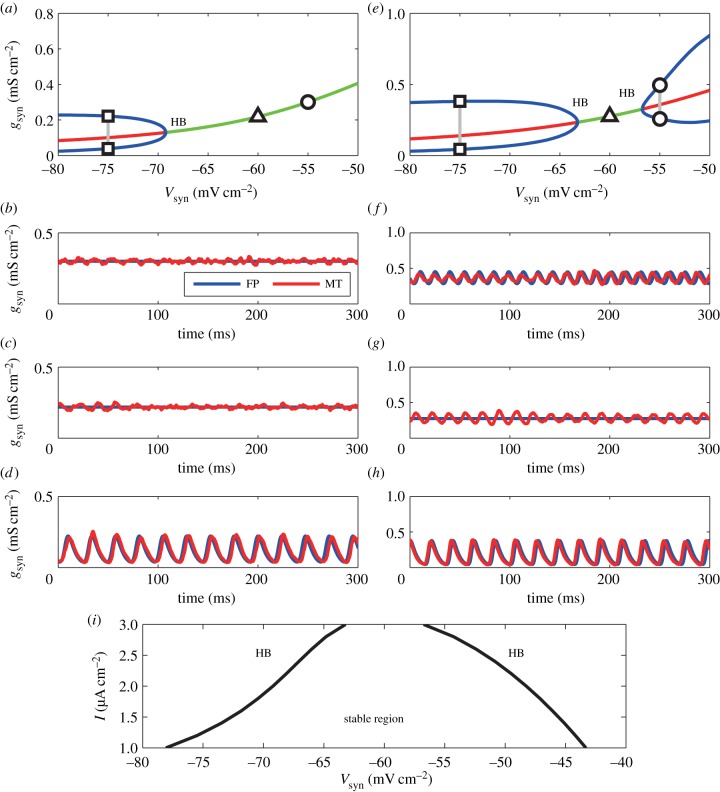
Figure 8.
Bifurcation diagrams with (psyn, I) = (0.05, 2) in (a) and with (psyn, I) = (0.05, 3) in (e). (a,e) The green line is a stable fixed solution and the red one is an unstable one. The blue lines indicate the upper bound and lower bound of the Hopf oscillation. HB, Hopf bifurcation. (b–d) Time course of the conductance gsyn obtained by the Fokker–Planck (FP) equation and the modified theta (MT) model. Vsyn = −55 mV in (b,f), Vsyn = −60 mV in (c,g) and Vsyn = −75 mV in (d,h). In the case of (psyn, I) = (0.05, 2) (in (a)), as Vsyn is increased, the gamma oscillation disappears above Vsyn ≃− 69.0 mV and a stable fixed firing mode emerges. On the other hand, when we adopt (psyn, I) = (0.05, 3) (in (e)), gamma oscillations appear in both regions below Vsyn ≃− 63.0 mV and above Vsyn ≃− 56.5 mV. Between them, a stable fixed firing state appears in the solution of the FPE. (i) Two-dimensional bifurcation diagram for shunting inhibition. In the region of 1 ≤ I ≤ 3 and −80 ≤ Vsyn ≤− 40, there are two Hopf oscillatory regions and there is a stable state between them. Besides Vsyn, psyn and I, parameters in this figure are set as nominal values.

