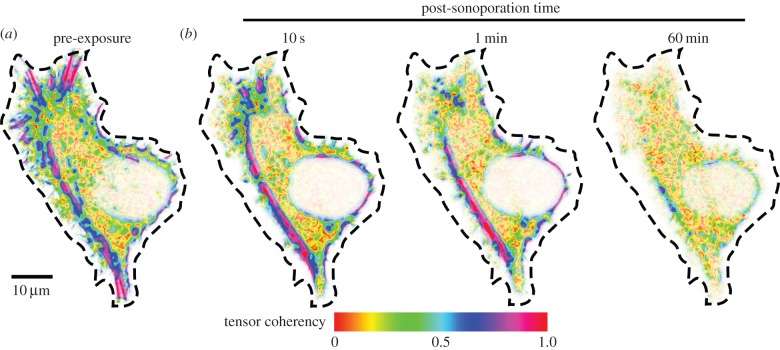
Figure 3.
Tensor coherency maps of local actin structure for the sonoporated cell shown in figure 2 (cell boundary indicated by dashed line). Comparing to the pre-exposure form (a), post-sonoporation actin structure exhibited progressive loss of tensor coherency (b) for 10 s, 1 min, and 60 min after sonoporation. For pixels with coherency values near unity (blue–magenta colour codes), their actin structure exhibits a dominant orientation; pixels without significant actin structure orientation have coherency values near zero (red–yellow colour codes).

