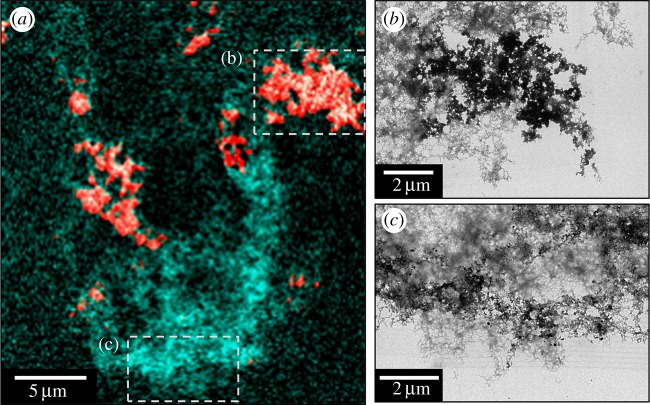
Figure 4.
STXM and TEM images of a Aβ aggregate allowed to incubate for 48 h prior to the addition of iron(III). (a) A composite image showing the Aβ (cyan) and iron (red) content of the Aβ/iron aggregate. TEM images showing the fibrillar structure of the Aβ/iron aggregate in areas of high (b) and low (c) iron content as displayed in (a).

