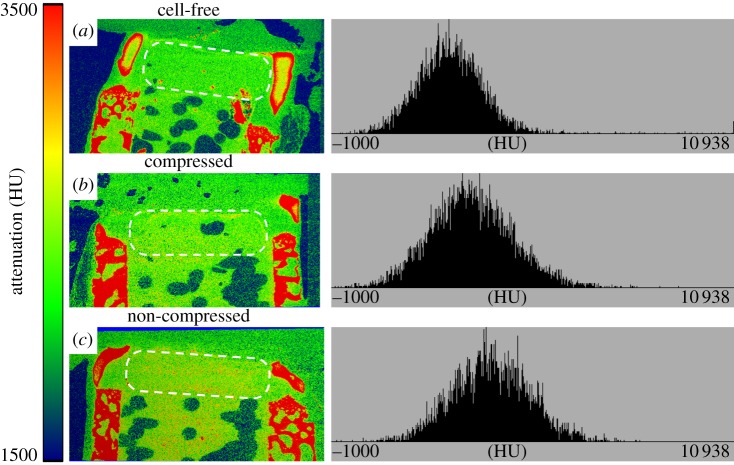
Figure 3.
EPIC-µCT images and histograms of attenuation in the cartilaginous compartments (dotted area) following in vivo implantation. Lower attenuation levels indicate higher GAG content and high attenuation levels indicate bone or tissues with low GAG content. (a) Cell-free alginate gel, (b) alginate gel subjected to one week of compression and (c) non-loaded gel implanted within the cartilaginous compartment had similar attenuation levels between the different groups, and depth-dependent zonal variations were not observed. Bone-like attenuation patterns were visible in the outer rims of the bovine cartilage in all explants.

