Figure 7.
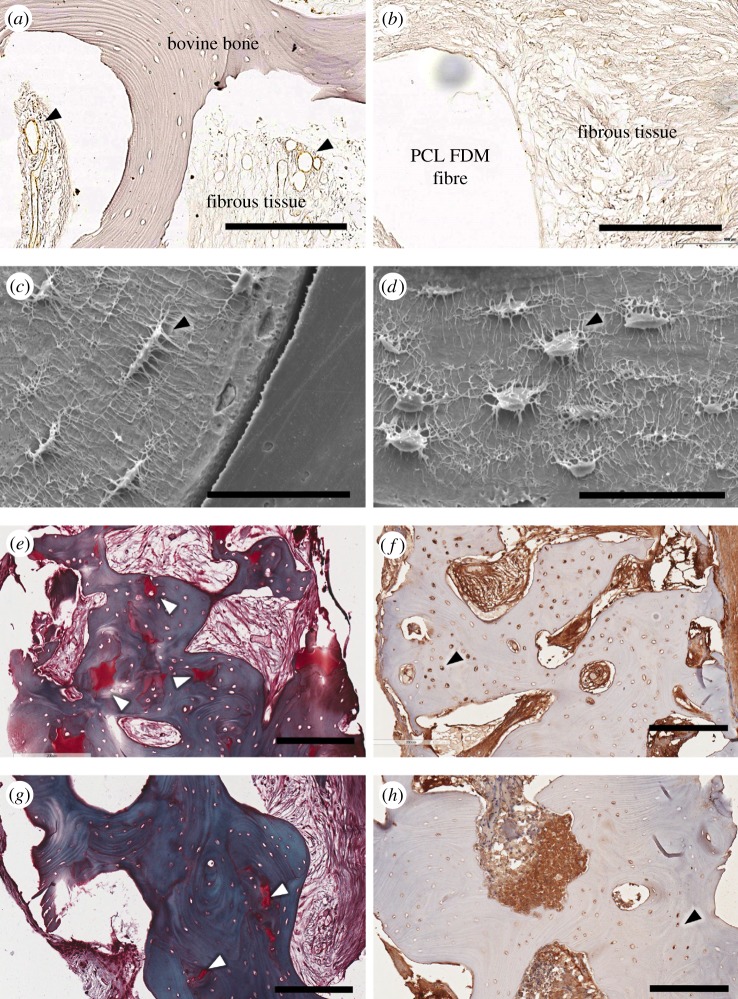
Representative imaging of the bovine bone across the different groups. vWF staining shows well-developed blood vessels in and around the bovine bone (black arrowhead) (a), while little to no defined vWF staining is visible within the osseous scaffold within the defect (b) from a NC sample. Osteocyte etching reveals well-preserved cells in the bone that are in close proximity to the infiltrated fibrous tissues (black arrowhead) (c) and those that are well within the bone (d) from a NC sample. Representative histological images from a NC sample, which indicate areas within the bone staining intensely with Safranin-O (top (e), bottom (g), white arrowhead). Sections of a compressed sample stained for ALP show depth-dependent staining patterns with more cells staining for ALP near the top portion of the bone (f) compared with those in the bottom (h) (black arrowheads). Scale bars: (a,b,e–h), 200 µm; (c,d), 50 µm. (Online version in colour.)

