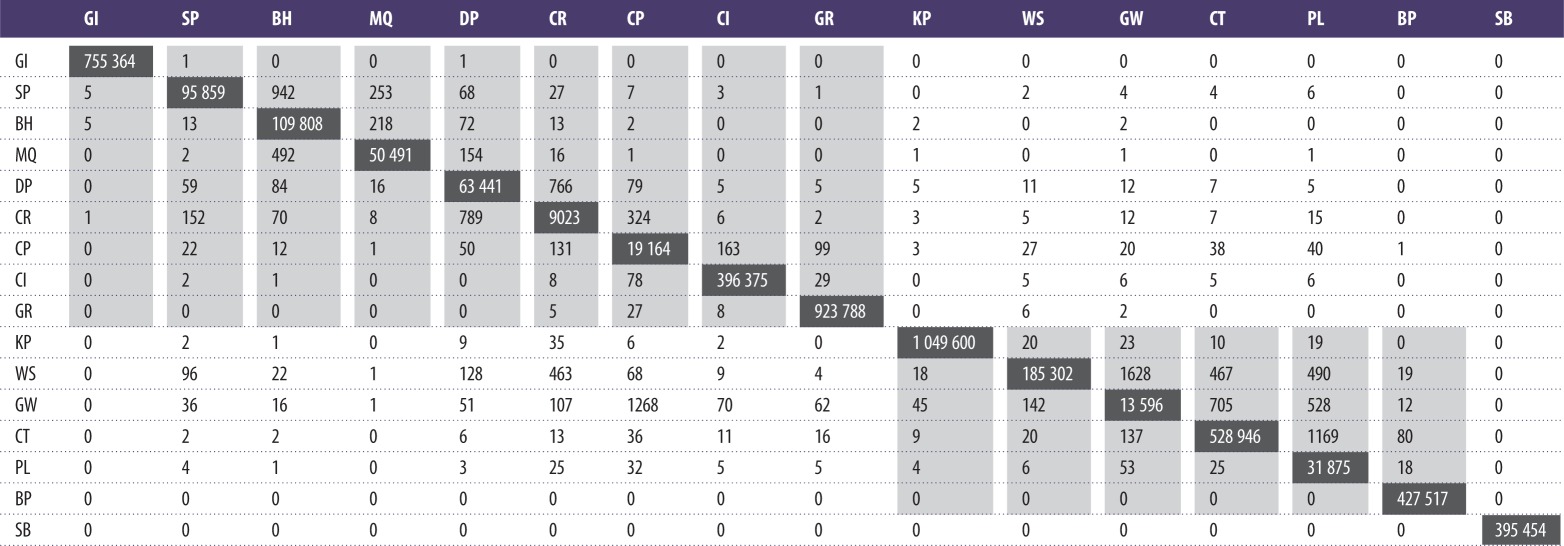
Table 5.
Indication of the connectivity between sites. Values represent the likelihood of number of particles (×10−9 m−2) to be found at each of the source release sites (horizontal axis across the top). Values between populations located on the same shoreline (with the exception of the outlying SB population) are shaded. Values on the diagonal (black boxes) represent numbers of particles remaining at the source release sites.
 |
