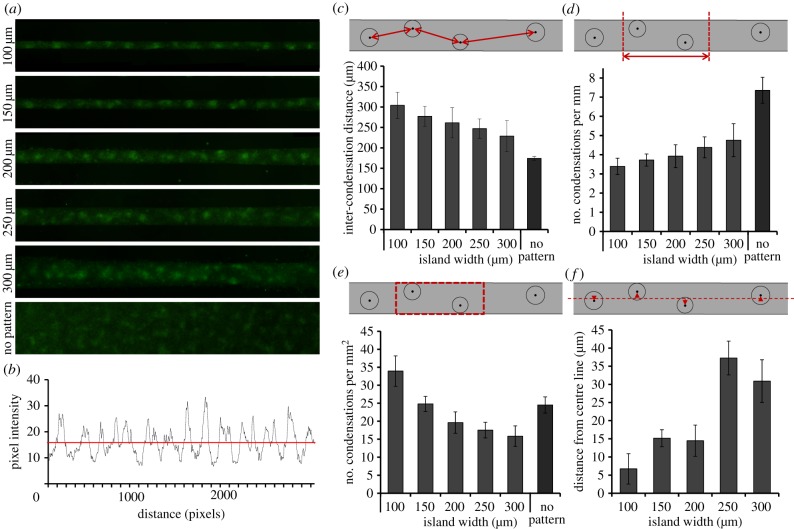
Figure 2.
Patterning of condensations under geometric constraints. (a) Fluorescent micrographs of PNA lectin staining (green) indicating mesenchymal condensations on linear islands of varying width and on non-patterned substrates after 2.5 days in culture, as used for quantitative analysis. (b) Representative intensity plot of PNA lectin staining of cells cultured on a 150 μm wide island for 2.5 days, indicating the pixel intensity along a line drawn along the long axis of the island. The horizontal red line indicates the threshold used for quantitative image analysis to identify the location of the condensations. (c) The inter-condensation distance, the distance between neighbouring condensations, is plotted against the width of the adhesive islands. Linear regression analysis shows a statistically significant trend between the inter-condensation distance and the island width ((F = 34.74) > (Fcritical = 7), p < 0.0125). Data represent mean ± s.d. from n ≥ 7 8-mm long islands from two independent experiments. (d) Plot of the number of condensations per unit length of adhesive island as a function of the island width. Linear regression analysis shows a statistically significant trend between the number of condensations per unit length and the island width ((F = 27.22) > (Fcritical = 7.09), p < 0.0125). Data represent mean ± s.d. from n ≥ 6 8-mm long islands from two independent experiments. (e) The number of condensations per unit area of adhesive island, obtained by dividing the number of condensations per unit length by the island width, is plotted against island width. Linear regression analysis shows a statistically significant trend between the number of condensations per unit area and the island width ((F = 103.47) > (Fcritical = 7.09), p < 0.0125). Data represent mean ± s.d. from n ≥ 6 8-mm long islands from two independent experiments. (f) The distance to the centre line is the average distance of the centre of mass of the condensations to a line drawn through the middle of the adhesive island along its long axis. The distance to the centre line is plotted against the island width. Linear regression analysis shows a statistically significant trend between the distance to the centre line and the island width ((F = 63.77) > (Fcritical = 7.4), p < 0.0125). Data represent mean ±s.d. from n ≥ 5 8-mm long islands from two independent experiments. (Online version in colour.)

