Figure 4.
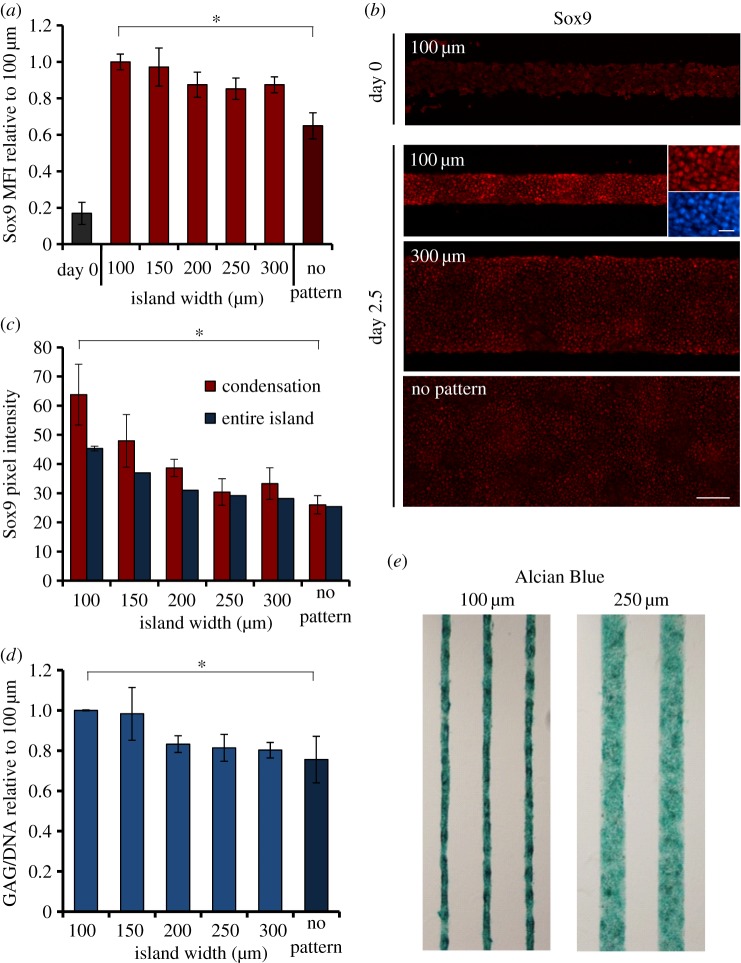
Chondrogenic differentiation under geometric constraints. (a) The mean fluorescent intensity of Sox9-stained cells was measured by flow analysis at day 0 (directly after isolation; grey column) and after 2.5 days in culture on adhesive islands of a range of widths and on non-patterned substrates. Data are normalized to the ‘100 μm’ condition. Linear regression analysis shows a statistically significant trend of Sox9 expression at 2.5 days with the island width ((F = 11.67) > (Fcritical = 4.41), p < 0.05). Data represent mean ± s.d., n = 4, *p < 0.0005. (b) Fluorescent micrographs of immunohistochemistry of Sox9 (red) at day 0 (100 μm, top) and day 2.5 (100, 300 μm and no pattern). A higher magnification of Sox9 (red) and DAPI (nuclei, blue) of the 100 μm island shows the nuclear localization of Sox9 at day 2.5. For the lower magnification, scale bar is 100 μm. For the higher magnification, scale bar is 20 μm. (c) The intensity of Sox9 staining was quantified on the entire island and in the condensations and plotted against the islands width. Linear regression analysis shows a statistically significant trend of Sox9 immonufluorescent intensity on the entire island, with the island width ((F = 35.03) > (Fcritical = 7.71), p < 0.05). Data represent mean ± s.d., n = 10, *p < 0.0005. (d) GAG content was quantified for 2.5-day cultures and normalized to DNA content. The data are presented relative to the ‘100 μm’ condition. Linear regression analysis shows a statistically significant trend of GAG/DNA content with the island width ((F = 16.74) > (Fcritical = 4.75), p < 0.05). Data represent mean ± s.d., n = 3, *p < 0.05. (e) Colour micrographs of 2.5-day cultures stained with Alcian Blue, indicating the deposition of GAGs on 100 versus 250 μm islands. (Online version in colour.)

