Figure 6.
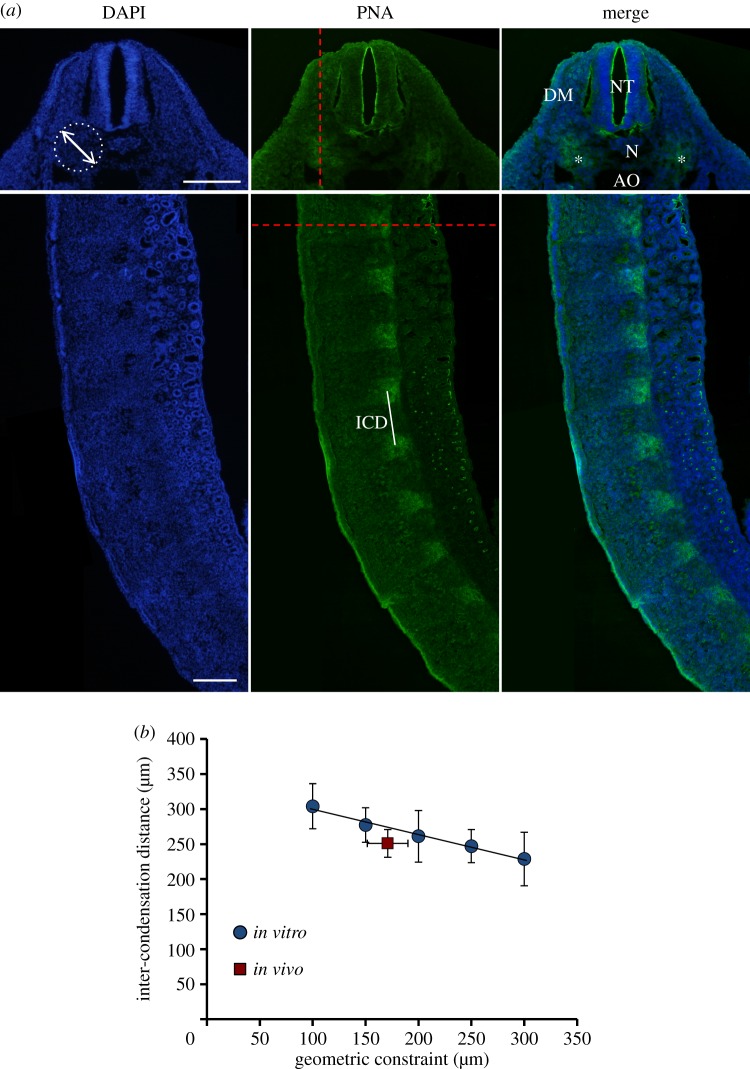
Patterning of condensations in vivo. (a) Fluorescent micrographs of transverse (top) and sagittal (bottom) sections of a chicken embryo at HH stage 22. Cell nuclei are stained blue (left) and PNA lectin staining is indicated in green (middle). Red dashed line in transverse section indicates the cross-sectional plane of the sagittal section and vice-versa. The white dashed circle indicates the estimated geometric constraint of the population of sclerotomal cells. Neighbouring tissues that provide the spatial constraints are the neural tube (NT), the dermamyotome (DM), the notochord (N) and the aorta (AO). Mesenchymal condensations in the transverse plane are indicated with an asterisk (*). The inter-condensation distance (ICD) is indicated in the sagittal section. Scale bars, 200 μm. (b) The inter-condensation distance is plotted against the geometric constraint for the in vitro model (also in figure 2c) as well as the chicken embryo (in vivo). For the in vitro model, the geometric constraint on the x-axis indicates the island width, while for the in vivo case it indicates the measured width of the population of sclerotomal cells (indicated by the white dashed circle in (a)). Data represent mean ± s.d. from 20 measurements from three embryos. (Online version in colour.)

