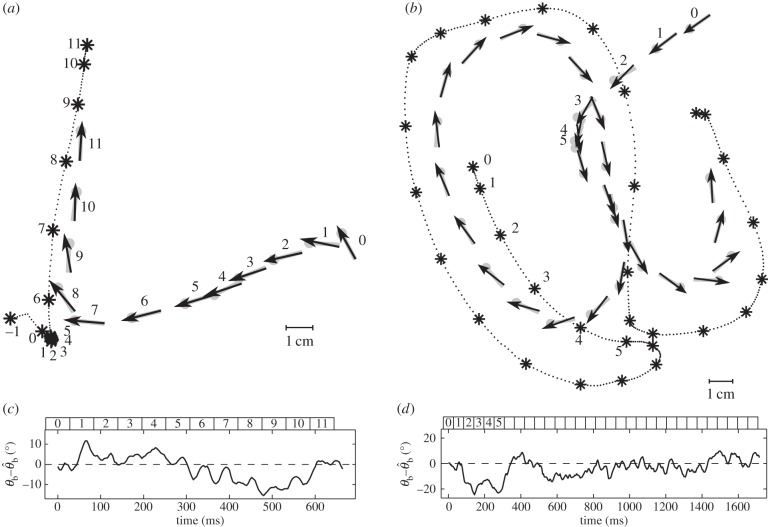
Figure 8.
Simulation of the beetle's body orientation θb predicted by the proportional controller for the chases in figure 6. The beetle's position is taken from the experimental data. Notations are the same as in figure 4. Typical trajectories of the beetle chasing a prey dummy moving along a straight (a) or sinuous (b) trajectory. Grey symbols = measured orientation θb, black arrows = simulated orientation  derived from the control law
  . (c,d) Deviation between the measured and predicted orientations for pursuits shown in (a) and (b), respectively. (c) For the simple trajectory (a), the mean deviation is 5.3 ± 4.0° (n = 167) with the maximum deviation of 15.5° that occurs after the sharp turn at strides 7–9. (d) For the more complex sinuous pursuit (b), the mean deviation is 6.7 ± 5.5° (n = 430) with the maximum of 24.6° occurring when the beetle almost stopped (strides 3–5).

