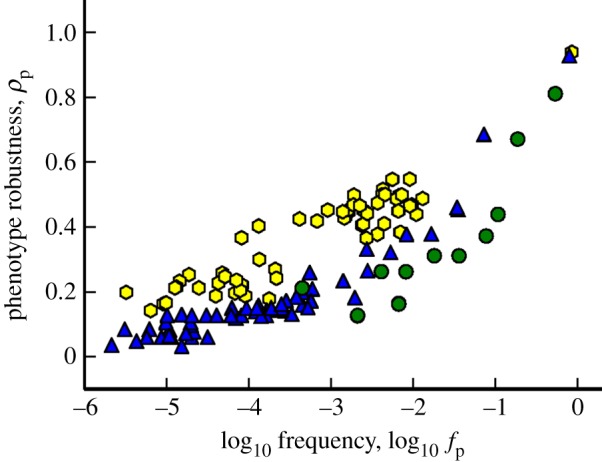
Figure 6.

Robustness in GP maps. Phenotypic robustness is plotted against frequency (log scale) for the Polyomino S2,8 (green), S3,8 (blue) and RNA L = 12 (yellow) GP maps. The top three points in the right-hand side of the plot are the UND/trivial structure in the respective Polyomino and RNA systems. In the RNA case, robustness scales linearly with log-frequency, with the exact coefficient of scaling being phenotype dependent [43]. While the trend is very roughly linear for the Polyomino GP maps, there is still a strong positive scaling relationship, demonstrating that polyomino phenotypes exhibit phenotypic robustness in a similar manner to the RNA GP map.
