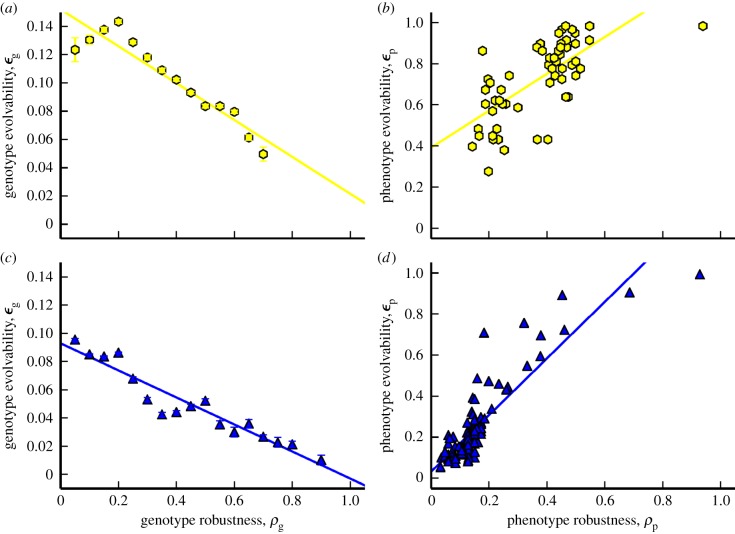
Figure 7.
Robustness and evolvability in the RNA and Polyomino GP map. In columns (a,c), we show a significant negative correlation between genotypic robustness and genotypic evolvability, εg (RNA (yellow, top): p-value = 4.9 × 10⁻⁷, r2 = 0.89 and Polyomino (blue, bottom): p-value = 2.4 × 10⁻⁹, r2 = 0.91). The error bars are the standard error on the mean genotypic evolvability for each genotypic robustness bin. The more robust a genotype is, the fewer phenotypes lie in its 1-mutant neighbourhood. In columns (b,d), there is a significant positive correlation between phenotypic robustness and phenotypic evolvability, εp (RNA: p-value = 1.5 × 10⁻⁹, r2 = 0.48 and Polyomino: p-value < 2.2 × 10⁻¹⁶, r2 = 0.74). The far right-hand phenotypes are the trivial structure and UND phenotype in RNA and Polyomino systems, respectively. Both these results are in correspondence with [30].

