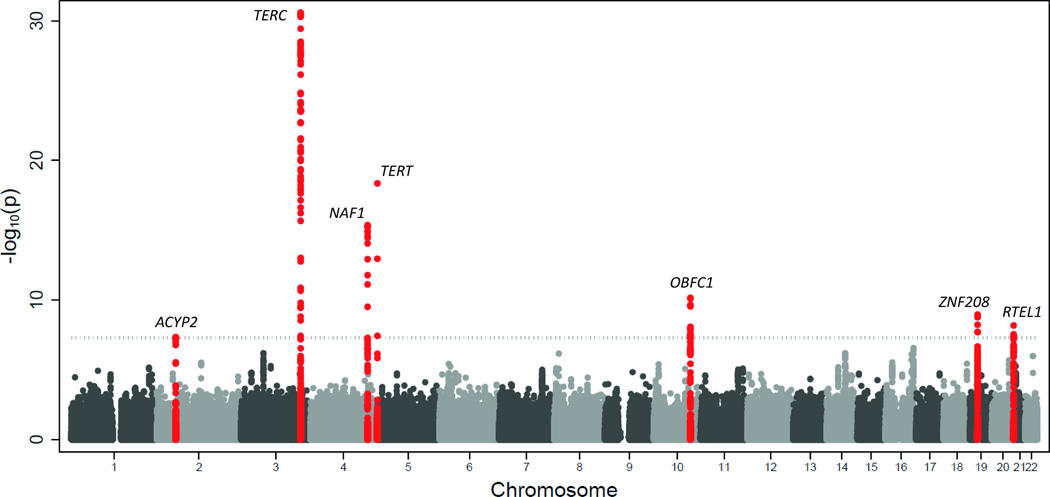
Figure 1. Signal intensity plot of genotype association with telomere length.
Data is displayed as –log10P values against chromosomal location for the 2,362,330SNPs that were tested. The dotted line represents a genome-wide level of significance at P=5x10⁻⁸. The 7 loci that showed an association at this level are plotted in red.

