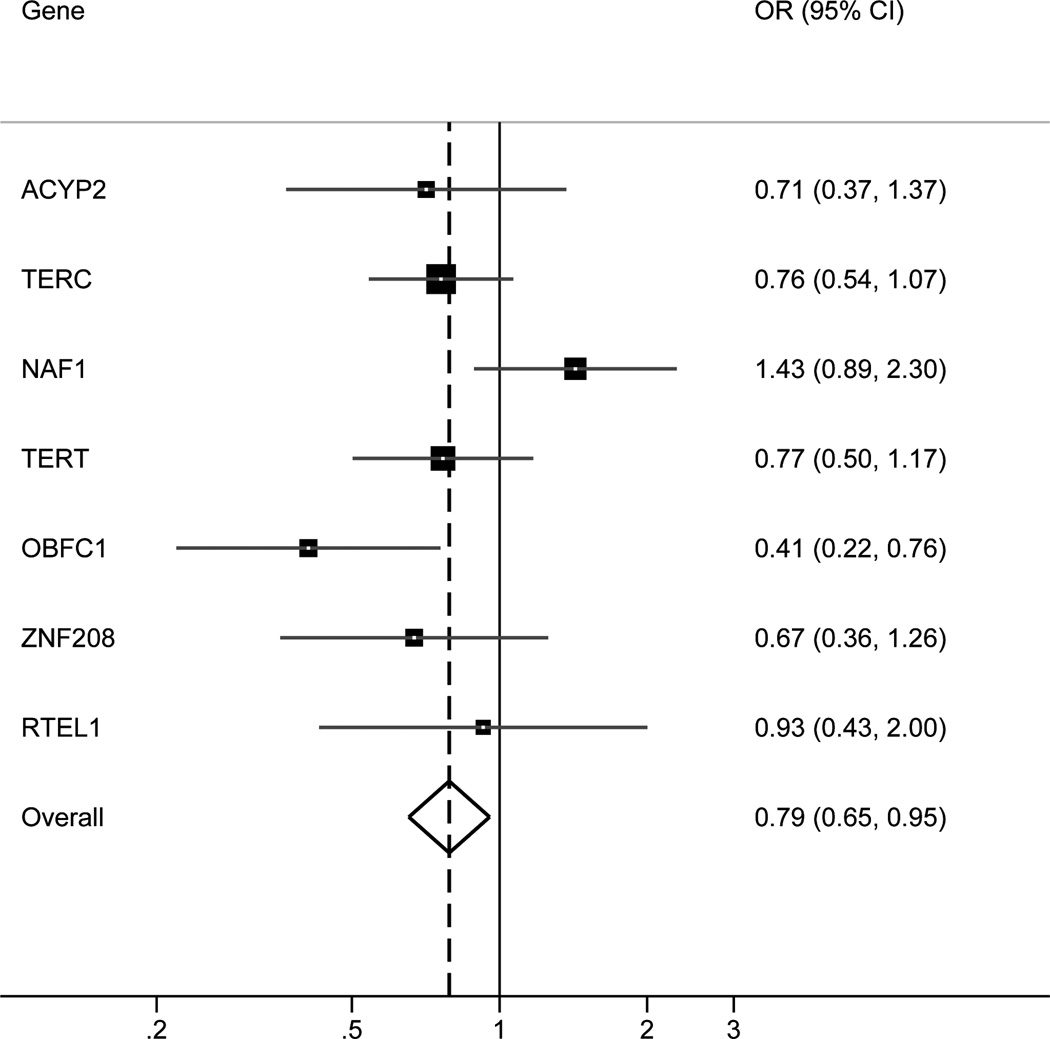
Figure 3. TL variants and risk of CAD.
Forest plot showing the effect of telomere length on CAD risk obtained for each SNP using a risk score analysis31 for each SNP. Effect sizes are plotted with 95% CI intervals. The overall estimate is from a fixed-effects meta-analysis over all SNPs, where the odds ratio relates to the change in CAD risk for a standard deviation change in telomere length.

