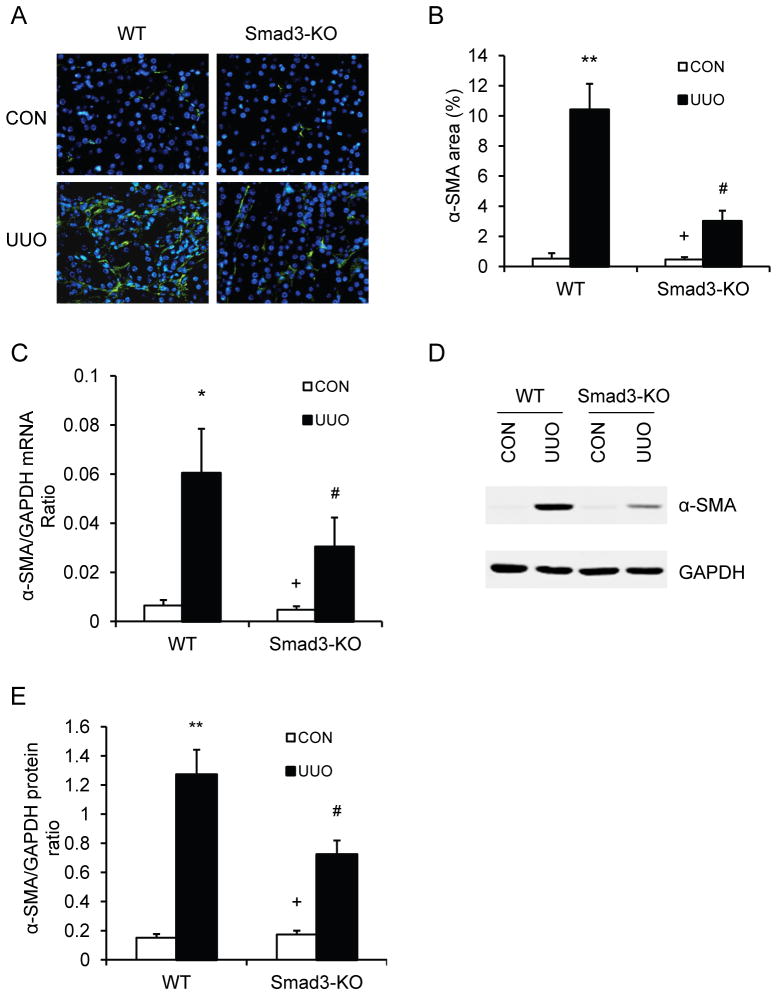
Figure 3. Smad3 deficiency inhibits myofibroblast activation and α-SMA expression in obstructive nephropathy.
A. Representative photomicrographs of α-SMA immunofluorescence staining in the kidney of WT and Smad3-KO mice 2 weeks after UUO. B. Quantitative analysis of α-SMA protein expression in the kidney of WT and Smad3-KO mice 2 weeks after UUO. ** P <0.01 vs WT controls, + P <0.05 vs KO UUO, and # P <0.05 vs WT UUO. n=5 per group. C. The mRNA levels of α-SMA in the kidney of WT and Smad3-KO mice as determined by real-time RT-PCR. * P < 0.05 vs WT controls, + P <0.05 vs KO UUO, and # P < 0.05 vs WT UUO. n=4 per group. D. Representative Western blots show the levels of α-SMA protein expression in the kidney of WT and Smad3-KO mice. E. Quantitative analysis of α-SMA protein expression in the kidney of WT and Smad3-KO mice. ** P <0.01 vs WT controls, + P <0.05 vs KO UUO, and # P <0.05 vs WT UUO. n=5 per group.

