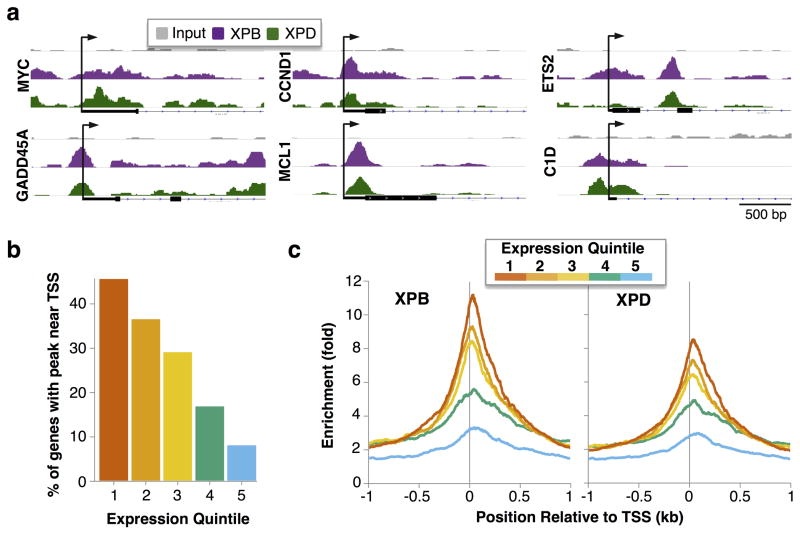
Figure 3. Enrichment of XPB and XPD at TSS is correlated with transcription.
(a) Selected fragment overlap maps near individual TSS. (b) Percent of genes in each expression quintile with enrichment of XPB or XPD near the TSS (±1 kb). TSSs were binned into quintiles based on gene expression (1 to 5, high to low), as determined by exon array analysis. (c) Fold enrichment of XPB and XPD fragment overlaps relative to Input near the TSS (±1 kb) for genes in each expression quintile.

