. 2013 Dec 12;10(3):412–420. doi: 10.1039/c3mb70420c

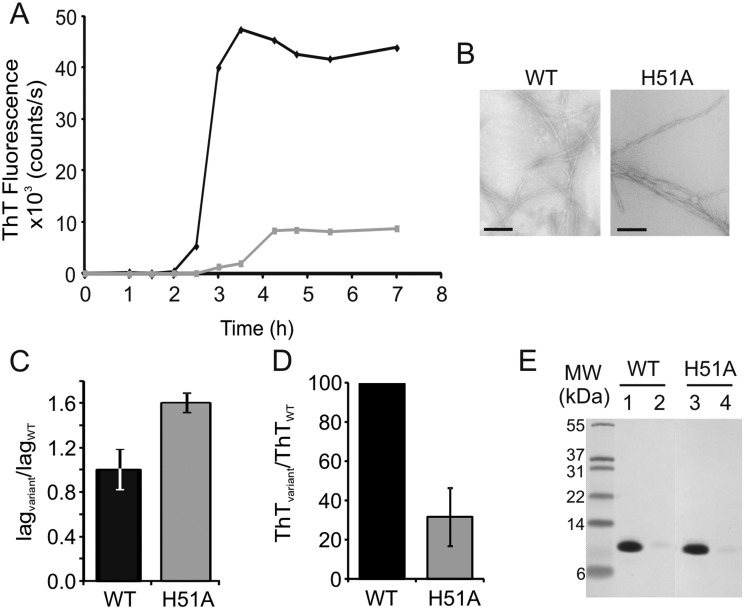
Fig. 2. (A) Graph showing ThT kinetics of fibril formation for WT β2m (black) and H51A (grey); one trace from five replicates is shown for each for simplicity. (B) Electron microscopy images of fibrils formed in 100 mM ammonium formate pH 2.5, 37 °C, 600 rpm, from WT β2m and the β2m variant H51A; the scale bar in each case represents 200 nm. (C) Fold change in lag-time of H51A compared with WT β2m; the average of five replicates is shown together with the standard deviation between replicates. (D) Final H51A ThT fluorescence signal expressed as a percentage of the WT β2m final ThT fluorescence signal; the average and standard deviation between five replicates is shown. (E) SDS-PAGE analysis of WT β2m (lane 1) and H51A (lane 3) prior to fibril formation compared with the remaining soluble fractions post-fibril formation (lanes 2 and 4 for WT β2m and H51A, respectively).

Fig. 2