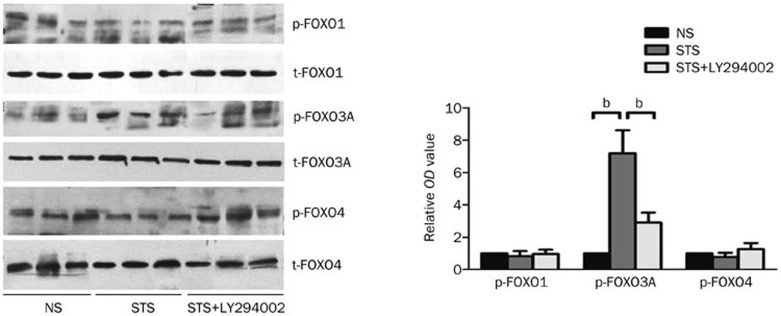
Figure 4.
The effect of STS on phosphorylated FOXO1, FOXO3A, and FOXO4 levels. Left: a representative Western-blot from left ventricle tissues isolated from each group showing the effect of STS on the levels of phosphorylated (p)-FOXO1, p-FOXO3A, p-FOXO4, total t-FOXO1, t-FOXO3A, and t-FOXO4. Right: the quantitative estimation of p-FOXO1, p-FOXO3A, and p-FOXO4 levels are shown as the relative OD values in STS and STS+LY294002 groups compared to the NS group. bP<0.05 was considered statistically significant among each group. n=8 animals in each group.

