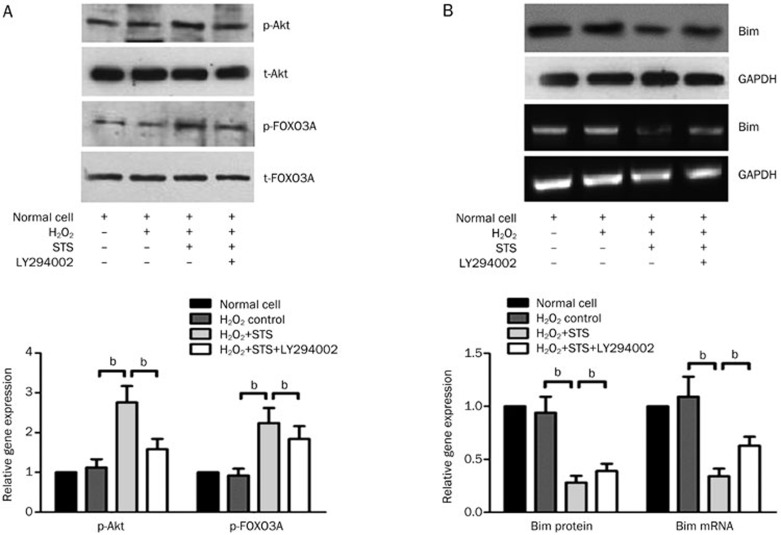
Figure 6.
In vitro effect of STS on phospho-Akt, phospho-FOXO3A and Bim expression of neonatal rat cardiac cells induced by H2O2. (A) A representative Western blotting photograph showing the effect of STS on the levels of p-Akt, total-Akt, p-FOXO3A, and total-FOXO3A from each group. The quantitative estimation of phospho-Akt and phospho-FOXO3A levels was shown as the relative OD values in STS and STS+LY294002 groups compared with the normal and H2O2-induced control group. (B) The expression levels of Bim mRNA and protein were analyzed using a semi-quantitative RT-PCR and Western blotting, respectively. GAPDH served as an internal control. The quantitative estimation of Bim mRNA and protein levels in the histogram are shown as the relative Bim mRNA and protein ratios in the STS and STS+LY294002 groups compared to the normal and H2O2-induced control group.

