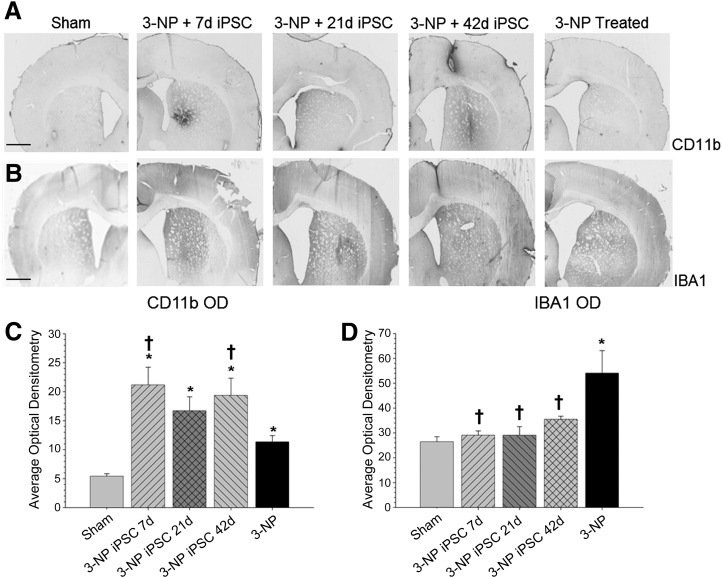
Figure 3.
Measures of inflammation. Analysis of the immune response as measured by optical densitometry of CD11b (A) and IBA1 (B) to 3-NP and transplanted iPSCs. Analysis of expression levels revealed significant between-group differences in the average optical densitometry of CD11b, with all groups receiving 3-NP having higher optical densitometry measures for CD11b than sham rats (C). Significant between-group differences in the average optical densitometry of IBA1 (D) were also observed, revealing that 3-NP rats without transplants had significantly more macrophage infiltration than sham rats and all rats receiving iPSC transplantation. (Bar graph represents mean value; error bars represent SEM; ∗, significantly different from sham rats, p < .05; †, significantly different from 3-NP rats, p < .05.) Abbreviations: 3-NP, 3-nitropropionic acid; iPSC, induced pluripotent stem cell; OD, optical density.

