
Figure 1.
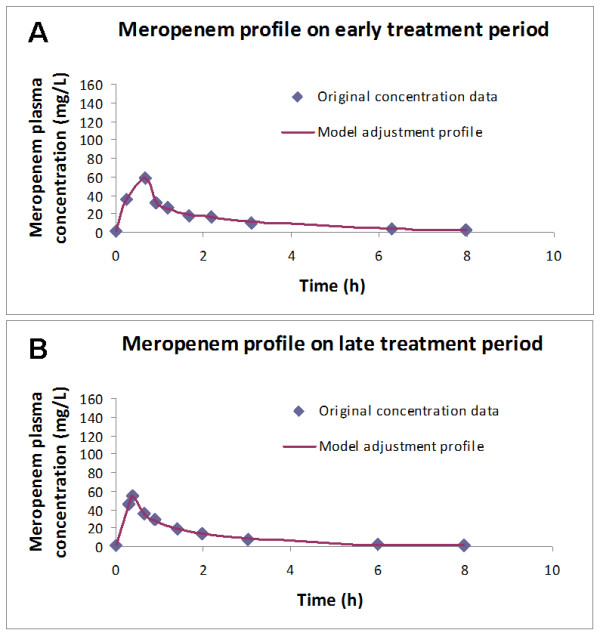
Concordance between predicted and observed meropenem concentration profile in patient #11, either in the early (panel A) or in the late phase (panel B) of therapy. The model was considered to be well adjusted.
Official websites use .gov
A
.gov website belongs to an official
government organization in the United States.
Secure .gov websites use HTTPS
A lock (
) or https:// means you've safely
connected to the .gov website. Share sensitive
information only on official, secure websites.
Concordance between predicted and observed meropenem concentration profile in patient #11, either in the early (panel A) or in the late phase (panel B) of therapy. The model was considered to be well adjusted.