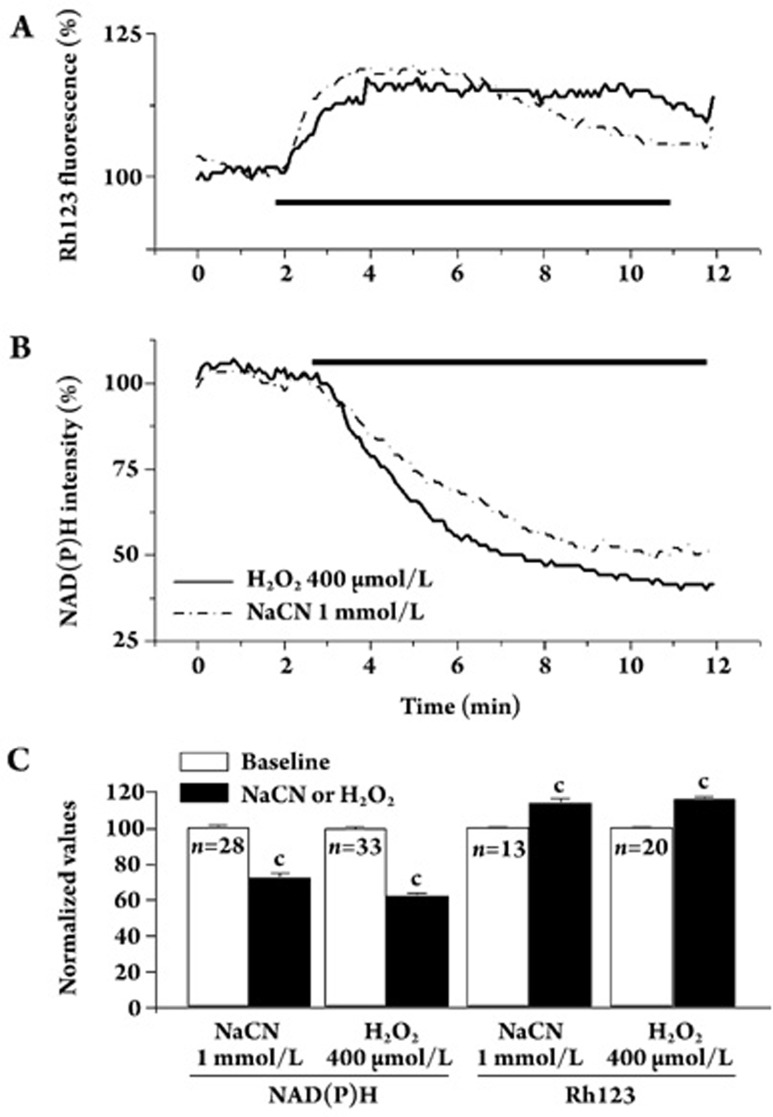
Figure 7.
H2O2 impaired mitochondrial function. (A) Rh123 intensity changes induced by 1 mmol/L NaCN (dashed line) and 400 μmol/L H2O2 (bold line). (B) NAD(P)H intensity changes induced by 1 mmol/L NaCN (dashed line) and 400 μmol/L H2O2(bold line). (C) Summary of the effects of 1 mmol/L NaCN and 400 μmol/L H2O2 on NAD(P)H and Rh123. Baseline values were measured at the 2-min time point and the NaCN-induced and H2O2-induced responses were measured at the 4-min time point for Rh123 intensity and at the 8-min time point for NAD(P)H intensity. Representative columns from 13−33 cells tested. cP<0.01 vs baseline.

