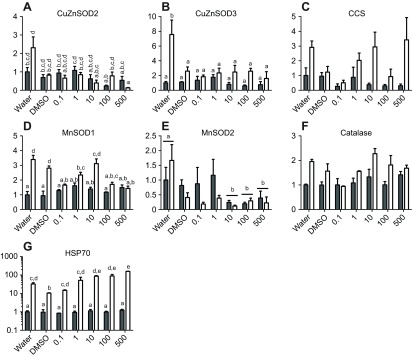
Fig. 5.

Transcript expression of putative stress-response genes following a 96 h exposure to high UV and/or varying concentrations of B[a]P. Open bars indicate UV-exposed animals and filled bars indicate animals not exposed to UV. Data were analyzed using two-way ANOVA with significance at P<0.05. Pairwise comparisons for significant effects were conducted using Tukey's test. Each bar represents the mean ± s.e.m. of three replicates, except the 500 μg l−1 B[a]P and UV treatment, which had two replicates because of mortality in the third. Some data were transformed to achieve a normal distribution of residuals (no transform: D,F; log10: A,E,G; square root: B,C). For consistency of presentation, untransformed data are shown, except in G, where data are shown on a log scale because of the ~100-fold range in values. Significant UV effects were found in C and F. Significant chemical effects were found in C and E. In post hoc tests, significantly different chemical groups are indicated by bars with lowercase letters in C; no groups were significantly different in pairwise comparisons in E. When there was a significant interaction, lowercase letters are used to indicate statistically different groups. Unlabeled groups are not statistically different from any other group.
