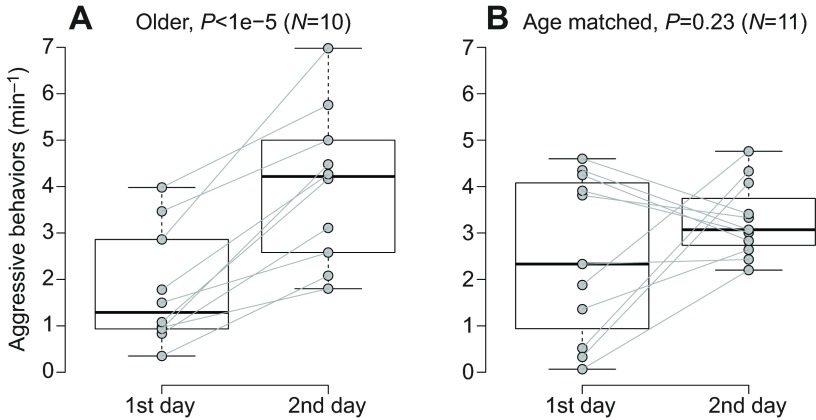
Fig. 3.
Older fish show an increased rate of aggressive behaviors from day 1 to day 2 while age-matched animals do not. (A) Among winners that were older than their opponent, there was a significant increase in rate of aggressive behaviors (y-axis) on day 2 of the encounters compared with day 1 (P<1×10⁻⁵, bootstrap paired t-test). This was not seen in age-matched winners (B; no winners were younger than their opponent), suggesting time in social interactions provides experience to develop a strategy. (B) Among age-matched winners, there was no difference in the rate of aggressive behaviors from day 1 to day 2 (y-axis). Each gray circle is the day 1–day 2 difference for a single winner fish. Top and bottom of boxes represent the first and third quartiles, respectively; whiskers extend to the most extreme data points no more than 1.5 times the interquartile range from the box; and horizontal lines within the boxes represent group medians.

