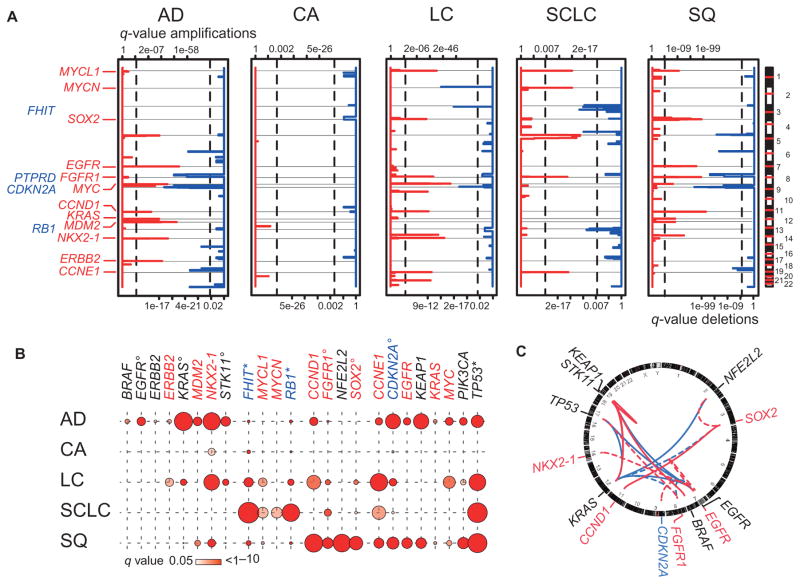
Fig. 2. Genomic alterations in histological subgroups of lung cancer.
(A) Significantly amplified (red) and deleted (blue) regions calculated using a rank sum–based algorithm (24) are plotted along the genome (y axis) for the five major lung cancer subtypes [AD (n = 421), CA (n = 69), LC (n = 101), SCLC (n = 63), and SQ (n = 338)]. Statistical significance, expressed by q values (x axes: amplification, upper scale; deletion, lower scale), was computed for each genomic location. Known or potential oncogenes (red) or tumor suppressor genes (blue) are given at respective locations. Vertical lines indicate level of significance of q = 0.01. (B) Frequencies of significant genomic alterations are given per gene per histological subtype. Colors of gene names are encoded as follows: red, amplified; blue, deleted; and black, mutated. Frequencies of alterations correspond to circle size [frequencies of deletions of FHIT and RB1 and mutations in TP53 were adapted by dividing values by three (asterisks); frequencies of mutations in EGFR, KRAS, and STK11, of deletions in CDKN2A, and of amplifications in FGFR1 and SOX2 were adapted by dividing values by two (circles)]. Significant mutations were determined using a binomial test with a background mutation rate of 0.5%. P values were adjusted for multiple hypothesis testing using the Benjamini and Hochberg method across each histological subtype. q values of significant results (q < 0.05) are indicated by the color code of the symbols (color key provided below the chart). (C) Associations of copy number alterations and mutations calculated using Fisher’s exact test followed by Benjamini and Hochberg adjustment are represented with a Circos plot. Involved genes are named at corresponding genomic locations (copy number gains in red, copy number deletions in blue, and mutations in black) outside the ring representing the genome. Internal lines show significant co-occurring (red) and mutually exclusive (blue) events (q < 0.05) between two copy number alterations or two frequently mutated genes (solid lines) or between a copy number alteration and a mutation (dashed lines) found in lung cancer.

