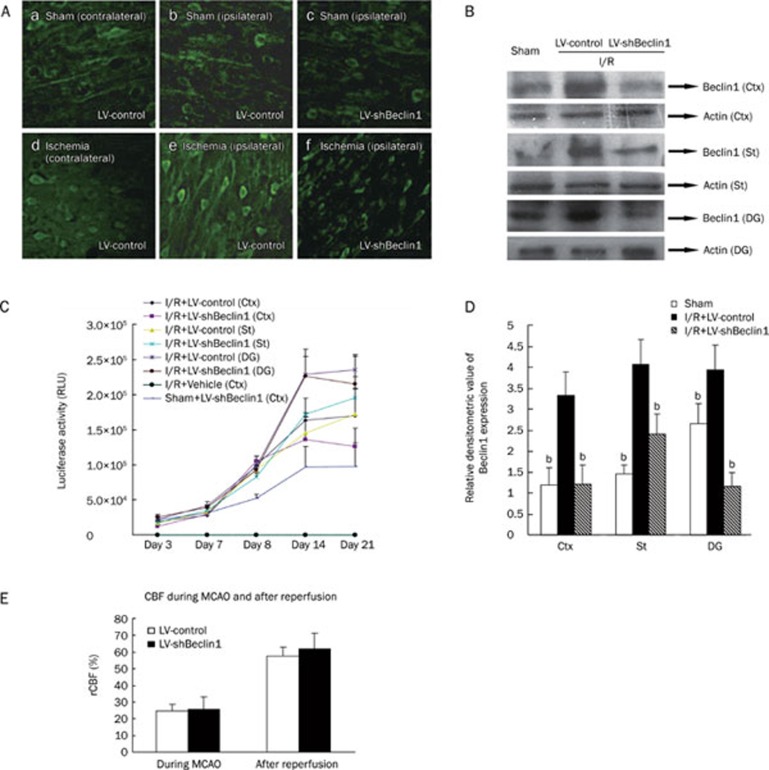
Figure 3.
Beclin1 expression in ipsilateral hemisphere following stereotaxic injection of LV-shBeclin1 or LV-control. (A) Staining of Beclin1 (green) at 24 h post-ischemia indicates that Beclin1 expression in the ipsilateral hemisphere is inhibited by stereotaxic injection of LV-shBeclin1. (B) Western blot analysis of Beclin1 expression in the ipsilateral cortex, striatum and DG at 24 h after reperfusion. (C) Quantitative analysis of luciferase activity. n=6. Mean±SD. (D) Bar graphs show quantitative evaluation of Beclin1 expression. Results were obtained from three independent experiments; only one representative experiment is shown, n=3. Mean±SD. A nonparametric test was used for statistical analysis. bP<0.05 compared with I/R+LV-control group. (E) CBF during MCAO and after reperfusion. n=5. Mean±SD. Ctx, Cortex. St, striatum. DG, dentate gyrus. I/R, Ischemia/Reperfusion.

