
Figure 3.
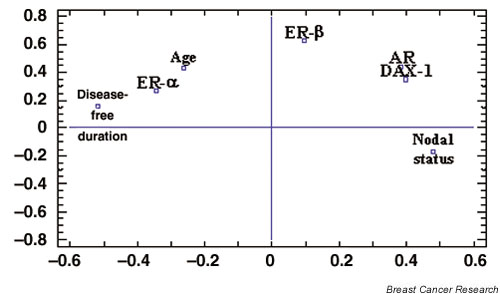
Two-dimensional component plot showing the results of the principal components analysis obtained from the 39 patients with infiltrative carcinoma. A close correlation between DAX-1 immunoexpression, nodal status, and AR expression is observed. Component 1 is on the x-axis; component 2 is on the y-axis.