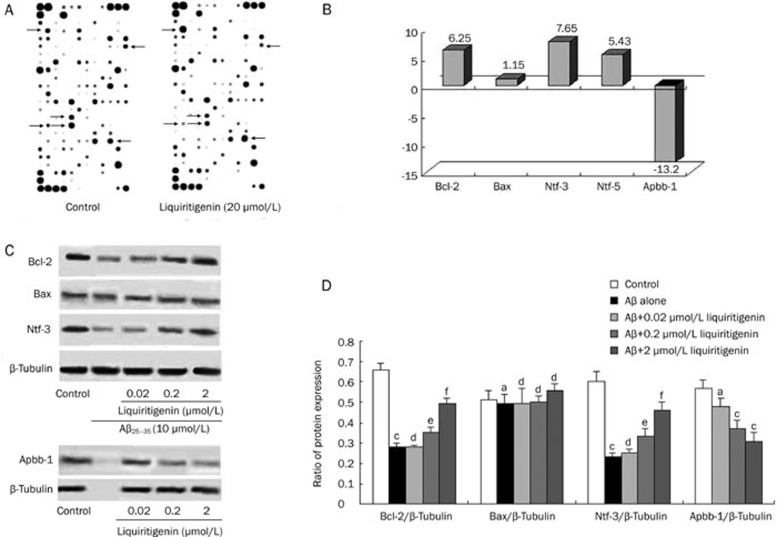
Figure 5.
Effect of liquiritigenin on expression of genes Bcl-2, Bax, Ntf-3, Ntf-5, Apbb-1 and relative protein expression in rat primary neurons. (A) Figures of microarray assay. Each marking represents a type of gene; arrowheads indicate some genes that were regulated by 2 μmol/L liquiritigenin treatment. (B) Changes in gene expression pattern determined by microarray assay. The fold change was calculated for each gene as the ratio of liquiritigenin/control (n=1). (C) Representative photos of Western blots. For detection of Bcl-2, Bax, and Ntf-3, cells were pretreated with various concentrations of liquiritigenin for 24 h prior to insult by 10 μmol/L Aβ25–35 for 72 h. For examination of Apbb-1 levels, cells were treated with liquiritigenin alone. (D) Quantitative densitometric analysis. Ratio is expressed as percentage of grey level of β-tubulin (mean±SEM, n=3). aP>0.05, bP<0.05,cP<0.01 vs control; dP>0.05, eP<0.05, fP<0.01 vs Aβ25–35 alone.

