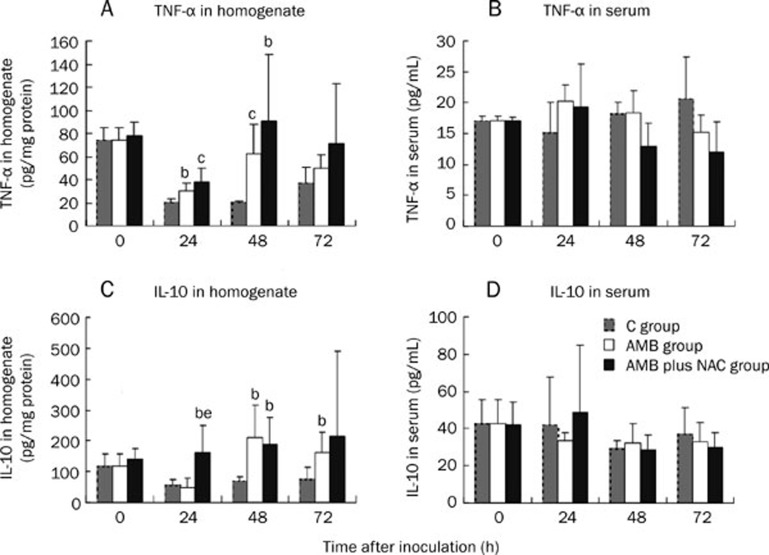
Figure 4.
Influences of different interventions on the cytokines in sera and lung homogenates of mice of invasive pulmonary Aspergillosis. White bar represents data for AMB group which was treated with amphotericin b (AMB), and black bar for AMB plus NAC group which was treated with AMB combined with N-acetylgalactosamine (NAC) while grey bar for the control group. TNF-α and IL-10 contents in the right lungs and in serum of the mice were determined by ELISA. (A) The concentration of TNF-α in homogenates; (B) The concentration of TNF-α in sera; (C) The concentration of IL-10 in homogenates; (D) The concentration IL-10 in sera. bP<0.05, cP<0.01 vs C group. eP<0.05 vs AMB group.

