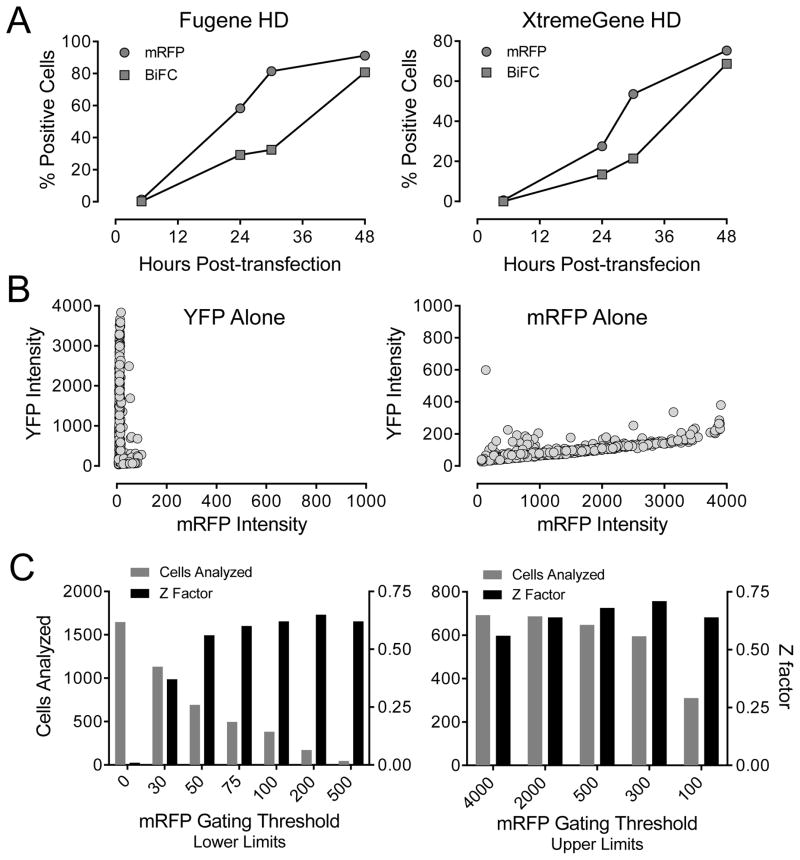
Figure 2.
Characterization of single-plasmid biosensors for Nef dimerization using the ArrayScan II imaging platform in transfected 293T cells. (A) Time course of fluorophore expression. Cells were transfected with the Nef-WT2A plasmid and imaged on the ArrayScan II at the time points indicated for expression of the transfection marker (mRFP) and for Nef dimerization (BiFC). The percentage of cells positive for the BiFC and mRFP fluorophores is plotted against time for two different transfection reagents. (B) Compatibility of ArrayScan II filter sets. Cells were transfected with plasmid vectors for expression of either YFP or mRFP alone and imaged 48 hours later using the Texas red (mRFP) and FITC (YFP) filters. Graphs show the average BiFC and mRFP intensities for a minimum of 16,000 individual cells. (C) Effect of mRFP gating on assay performance. Fluorescence data from cells transfected with the Nef-WT2A plasmid were gated into mRFP-positive subpopulations by applying a lower-limit threshold in the Texas-red channel. An upper-limit threshold was applied to reduce mRFP signal overlap into the BiFC channel. Assay performance was then assessed by calculating Z-factors for each gating threshold. Exclusion of non-transfected cells (mRFP fluorescence < 50) dramatically increased assay performance (left panel). In contrast, exclusion of cells with very high mRFP levels had little effect on assay performance (right panel).

