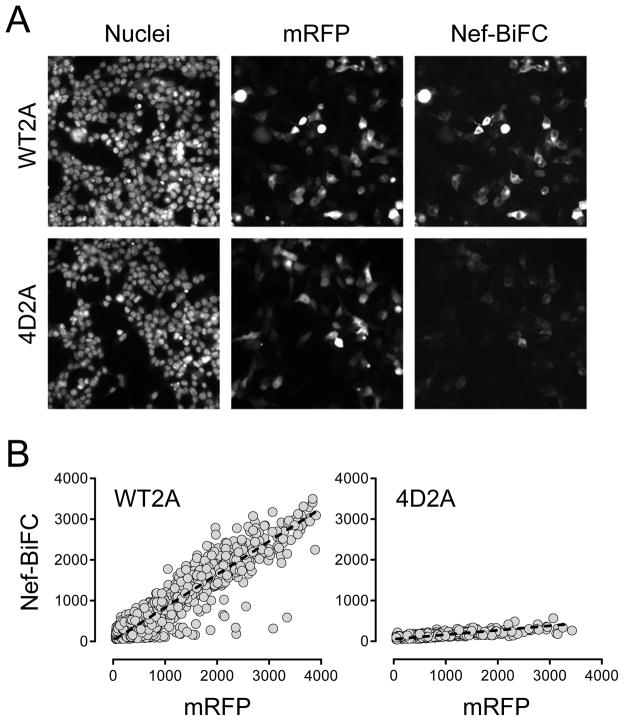
Figure 3.
Automated imaging of 293T cells transfected with the Nef-WT2A and Nef-4D2A plasmids. (A) Representative images of transfected cells acquired on the ArrayScan II. Transfected cells were fixed and stained with the DNA stain Hoechst 33342, and images were acquired in the DAPI (nuclei), Texas red (mRFP) and FITC (Nef-BiFC) channels. B) The average Nef-BiFC and mRFP fluorescence intensities were recorded for a minimum of 16,000 individual cells expressing wild-type (WT2A) and dimerization-defective (4D2A) Nef-BiFC pairs. The resulting signal intensities were plotted as shown and best-fit by linear regression analysis (dotted line), yielding slopes of 0.81 for wild-type Nef and 0.11 for the 4D mutant.

