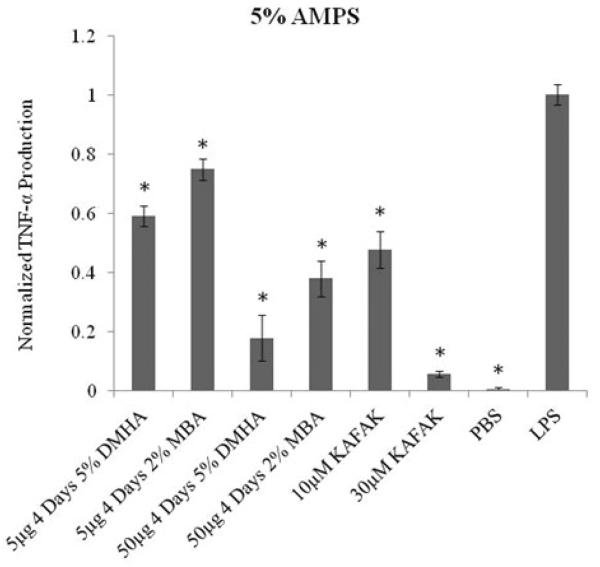
Figure 2.
TNF-α production in THP1 human macrophage model treated with different concentrations of DMHA, MBA and KAFAK. Positive and negative controls are represented as treatment with PBS and LPS respectively. Bars represent average±SEM (N=4). * denotes statistical significance (p<0.05) between treatment groups and LPS.

