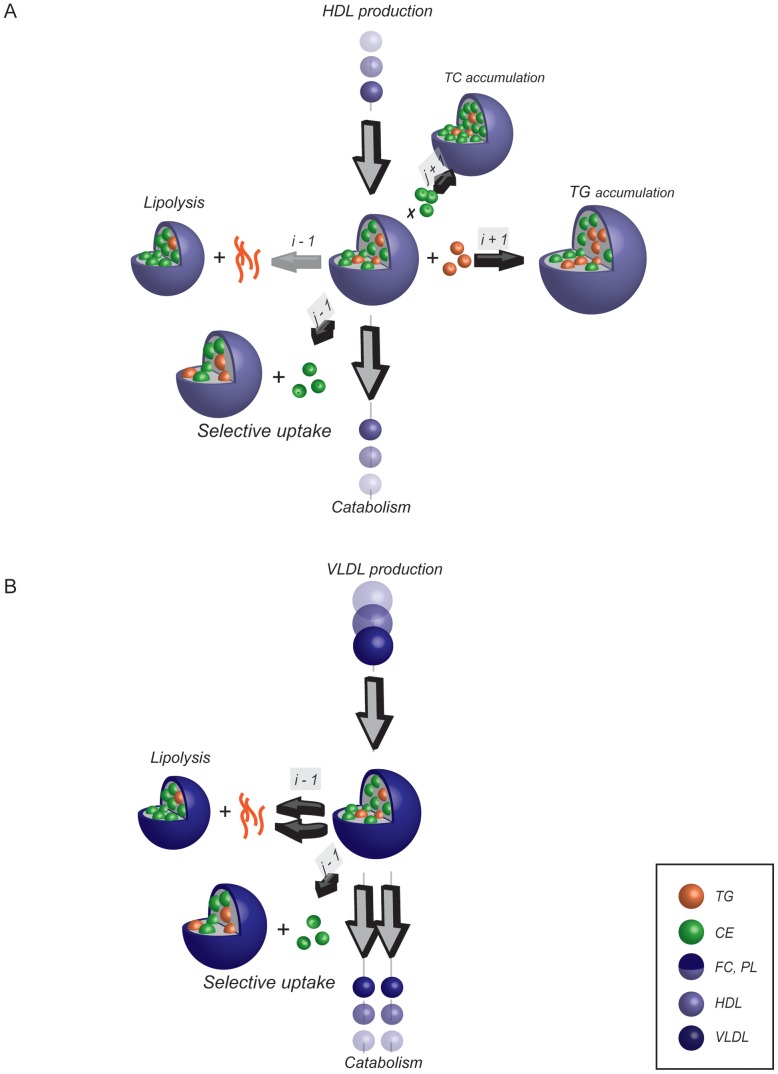
Figure 2. Lipoprotein metabolism model.
A. Visualization of the HDL metabolism model. The central lipoprotein represents the lipoprotein with grid coordinates (i,j). The arrows represent the 6 processes that together determine the HDL distribution. HDL production and catabolism involve lipoprotein introduction to and removal from the grid and are pictured perpendicular to the plane of the grid. Within the lipoprotein grid, HDL may undergo lipolysis (resulting in a flux from (i, j) to (i−1, j)), obtain either CE or TG (resulting in a flux to (i, j+1) or (i+1, j) respectively) or undergo selective uptake of CE (resulting in a flux from (i, j) to (i, j−1)). A process in which the CE or TG content of the lipoprotein increases thus causes an increase of lipoprotein size and surface components, while a decrease of core lipid content is associated with a decrease in size and surface components (Figure 1 and Text S1). Each of the six fluxes is a function of lipoprotein composition and/or size. B. Visualization of the VLDL metabolism model. The VLDL sub-model structure is similar to the HDL sub-model structure, but the VLDL metabolism model differs from the HDL metabolism model. In the VLDL metabolism model lipoproteins may only decrease in size, and lipolysis and catabolism of VLDL are both the result of two equations. A full description of the lipoprotein metabolism model is given in Text S2.

