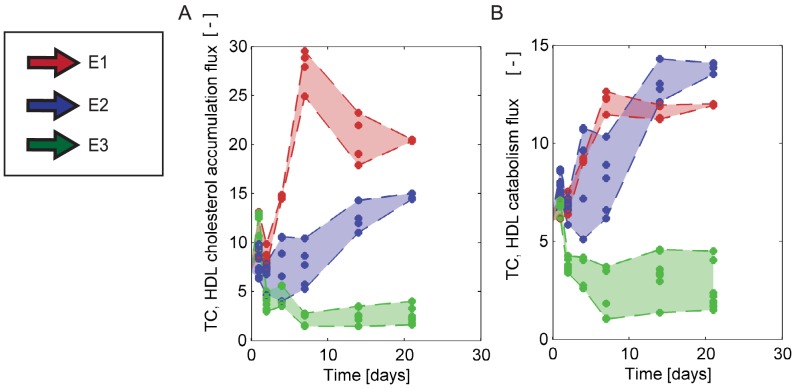
Figure 7. Quantitative distinction between hypotheses: fluxes.
Following the acquisition of sets of acceptable parameters for all treatment durations, the fluxes of the (extended) HDL sub-model are plotted, as a function of time in days, as a ratio to the HDL TC production flux. Red = E1; Blue = E2, Green = E3. Fluxes are shown as lipid fluxes, of either cholesterol or triglycerides in various processes. A Cholesterol flux due to cholesterol uptake by the HDL particle, B Cholesterol flux due to HDL catabolism.

