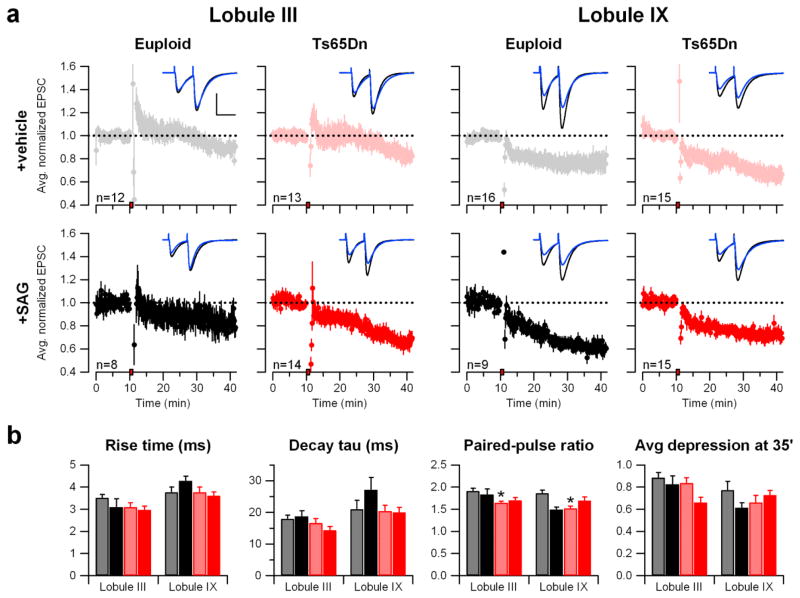
Fig. 2.
Cerebellar LTD is minimally different between Ts65Dn and euploid mice. a) Cerebellar long-term synaptic depression (LTD). EPSCs normalized to the baseline were averaged and plotted as a function of time for each group according to genotype (Euploid or Ts65Dn), treatment (vehicle or SAG), and cerebellar lobule (III or IX). The red box on the x-axis indicates the time of LTD induction. The error bars represent the SEM. The dashed line at 1.0 shows the position of the baseline. Representative traces before (black) and 25 minutes after (blue) LTD induction (t=35′) are shown superimposed. Scale bars = 50 msec, 200 pA. b) Bar graphs show the mean paired-pulse ratio measured at t=5′ (prior to LTD induction) and normalized EPSC at t=35′ (25′ after LTD induction). (Exact p-values for each measurement are in Table S2. On the figure, * p<0.05, **p<0.01, ***p<0.001).

