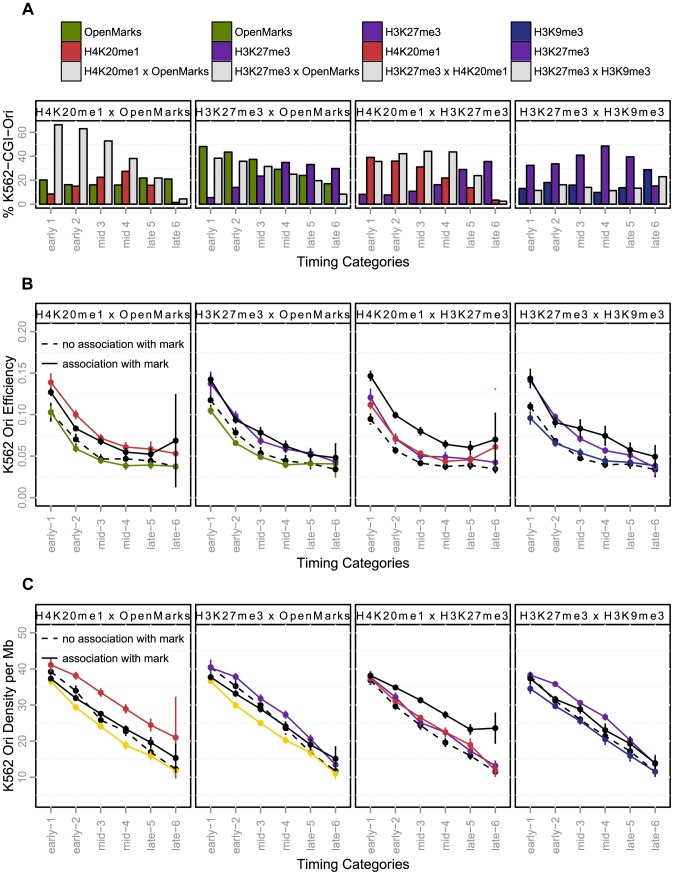
Figure 5. Effect of the coupling of histone marks and CGI-origins on origin efficiency and density (K562).
A: Percentage of CGI-origins associated with chromatin marks, according to timing categories (from early to late origins, as explained in the Methods Section). The colored bars indicate the percentage of CGI-origins associated with one mark only, and grey bars represent the proportion of CGI-origins carrying both marks simultaneously. B: Variations of origin efficiency (as defined by the number of reads divided by the length of the origin) according to replication timing. C: Variation of origin density (as defined by the number of origins per megabase) with the timing of replication. Colored lines indicate origins associated with a single mark; solid black lines represent origins carrying both marks simultaneously, and black dotted lines represent origins that do not carry the marks considered. The values shown are mean values with 95% confidence intervals. Interactions between marks are significant when the solid black line is above the colored line. OpenMarks indicates origins associated with H2AZ, H3K9ac or H3K4me3.

