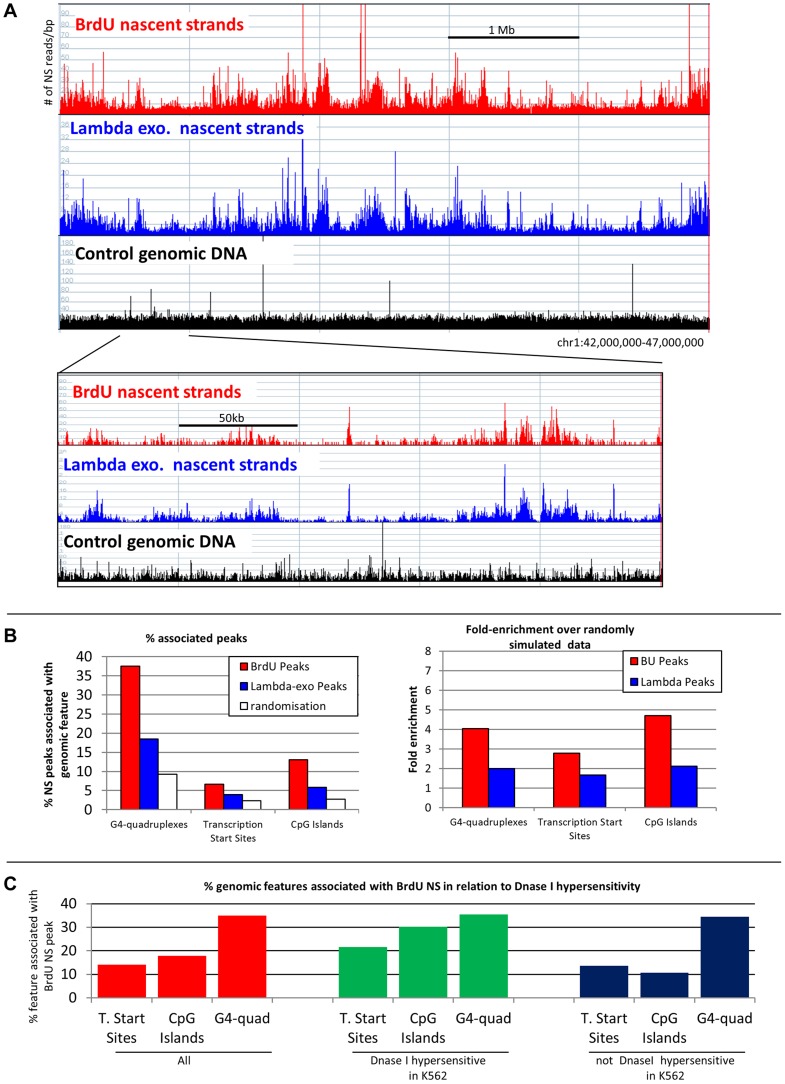
Figure 5. NS profiles.
A: Comparison of NS prepared using the lambda-exonuclease and BrdU methods. Profiles of newly replicated NS DNA in a 5 million bases pair region on chr 1 (250,000 for lower panel). Red bars: NS 0.5 to 1 kb in length were isolated by immuno-precipitation of newly replicated DNA labeled with BrdU. Blue bars: NS prepared using the lambda exo-nuclease method. Black bars: Sheared genomic DNA (mapability control) B: NS peaks are associated with 3 genomic features: left panel: histograms illustrating the association of G-quadruplexes, transcription start sites and CpG islands with nascent strand peaks generated by the BrdU (red bars) or by the lambda exonuclease (blue bars) methods. Bootstrap (white bars) = average association with randomly simulated data (100–1000 iteration gave the same results). Y-axis = percent BrdU NS peaks associated with a feature (100× # of NS peaks associated with feature/# of NS peaks). Right panel: enrichment over bootstrap: Y axis = (% associated peaks/% associated random peaks). C: Chromatin accessibility favors the formation of origins of replication at G-quadruplexes, transcription start sites and CpG islands: Red bars represent the percent of G-quadruplexes, transcription start sites and CpG islands that are associated with a BrdU NS peaks. Green and blue bars respectively represent the percent of G-quadruplexes, transcription start sites and CpG islands that are (green) or are not (blue) located within a DNase I hypersensitive site and that are associated with a BrdU NS peaks. DNase I hypersensitivity data is from K562 cells. Y-axis = % features associated with BrdU NS peaks.

