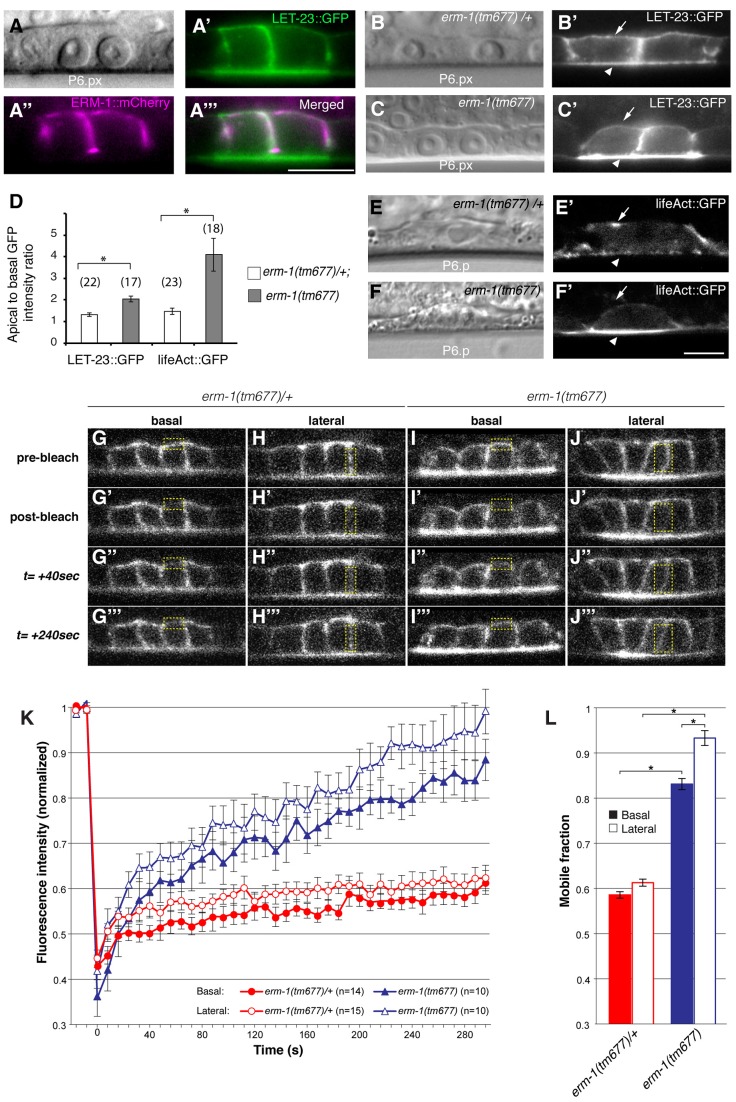
Figure 2. ERM-1 controls LET-23::GFP localization at the basolateral membrane of the vulval cells.
(A) Nomarski image, (A′) LET-23::GFP (green) and (A″) ERM-1::mCherry (magenta) expression at the Pn.px stage. (A′″) shows a merged image of (A′) and (A″) indicating partial co-localization at the basolateral membrane. (B) Nomarski and (B′) LET-23::GFP expression in a heterozygous erm-1(tm677)/+ and (C, C′) a homozygous erm-1(tm677) larva at the Pn.px stage. Arrows indicate the basal and arrowheads the apical membrane domains. (D) Apical to basal LET-23::GFP and lifeAct::GFP intensity ratios in P6.p in erm-1(tm677)/+ versus erm-1(tm677). The numbers of animals analyzed are indicated in brackets. Error bars represent the standard error of the mean. (E) Nomarski and (E′) lifeAct::GFP expression in P6.p of a heterozygous erm-1(tm677)/+ and (F, F′) a homozygous erm-1(tm677) larva. (G–J′″) Example images of the FRAP experiment at the time points indicated to the left of panels G-G′″. (G-G′″ and I-I′″) Basal and (H-H′″ and J-J′″) lateral membrane regions outlined with the dotted yellow boxes were photobleached in heterozygous erm-1(tm677)/+ and homozygous erm-1(tm677) larvae, respectively, at the Pn.pxxx stage. (K) Quantification of the FRAP experiments. The y axis indicates LET-23::GFP intensity normalized to the signal intensity measured before bleaching inside the bleached areas and to the total signal intensity in the cell, and the x-axis the time after photo-bleaching. The numbers of animals analyzed are shown in brackets. (L) Quantification of the mobile fraction from the FRAP curves. *Indicates p<0.05, as determined in a two tailed student's t-test - two-sample unequal variance. The scale bars are 10 µm.

