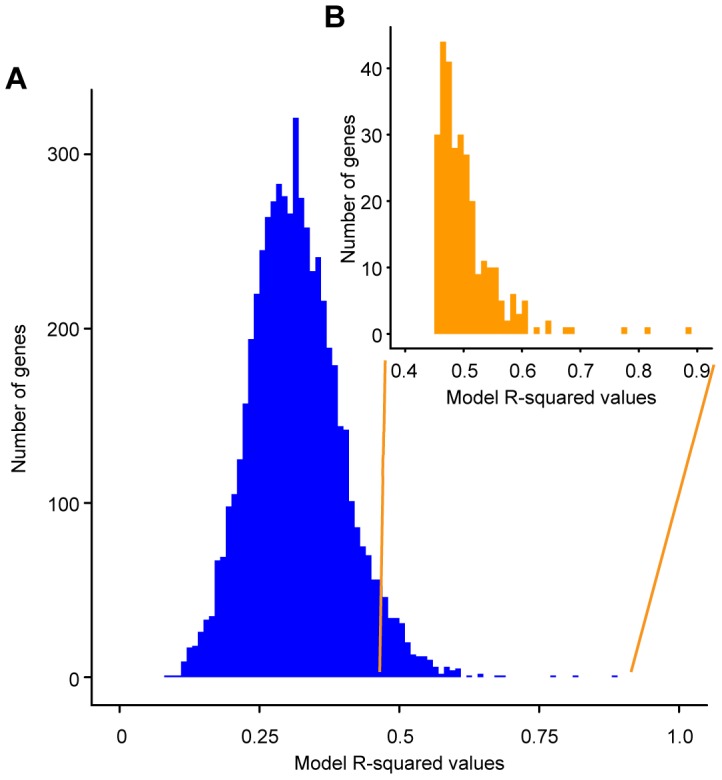
Figure 1. Histogram of R-squared values obtained for the linear models describing the effect of genotype on the expression of individual genes.

The R-squared values obtained are on the x-axis and the numbers of gene expression models with the particular R-squared values are on the y-axis. A) Histogram of the R-squared values for all 5792 genes in the S. cerevisiae genome. B) Histogram of the R-squared values for the 289 significant gene expression models (inset). Significant models have an unadjusted model p-value≤0.006.
