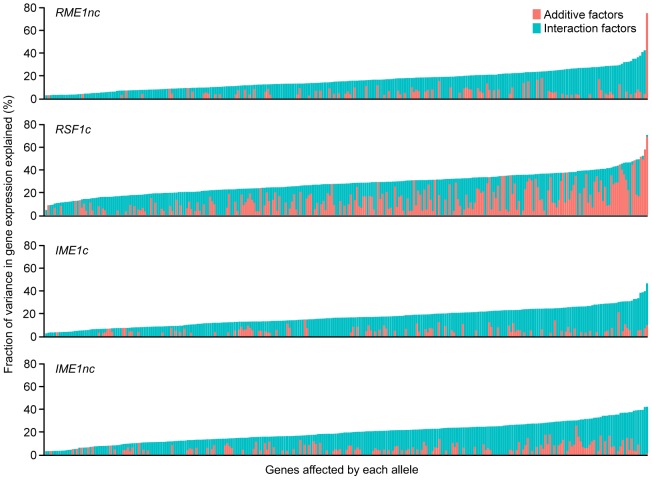
Figure 3. Fraction (%) of gene expression variance explained by main (pink) and interaction effects (cyan) of each of the four sporulation QTN.
The QTN effect on the 289 ORFs with significant gene expression models is shown. The ORFs are ordered by fraction of total variance explained in the full model. Plot includes only those models in which the fraction of gene expression variance explained by the particular QTN is greater than zero. Each column represents the amount of variation in gene expression explained for a given ORF. Only the significant ANOVA factors (f-statistic p-value<0.1) for each QTN were considered.

