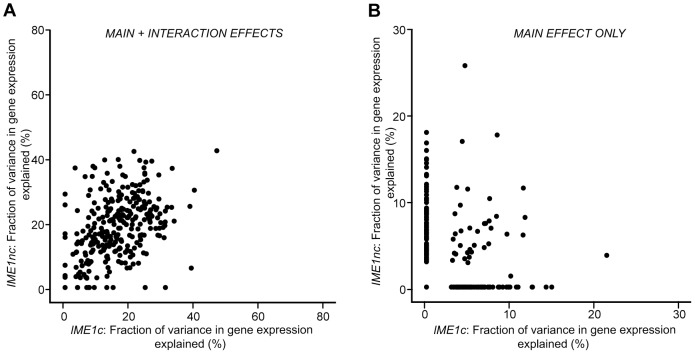
Figure 5. Scatter plot comparing the total fraction of variance explained by the Ime1nc and Ime1c alleles.
a) Fraction of variance explained by main and interaction effects. b) Fraction of variance explained by main effects alone. For each QTN, fraction of expression variance explained is calculated by using the significant main and interaction terms of the QTN (f-statistic p-value<0.1). Results are shown for the 289 ORFs with significant gene expression models.

