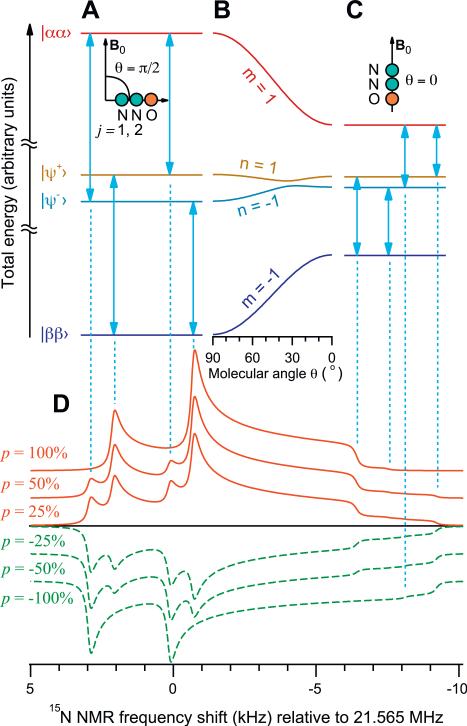
Fig. 3.
Total energy levels of the eigenstates of the Hamiltonian (Eq. (1)) for the molecules perpendicular (A: θ = π/2) and parallel (C: θ = 0) to the magnetic field B0. The detailed dependence of the energy levels on the molecular orientation θ is shown in (B). Spectral line shapes (D) for different polarization values, calculated using Eqs. (4)–(8), using the parameters of Table 1. Note the spectral features in (D) corresponding to the transitions in (A and C). The dependence of the spectral line shape on the polarization is the basis of the polarimetry technique proposed here.

