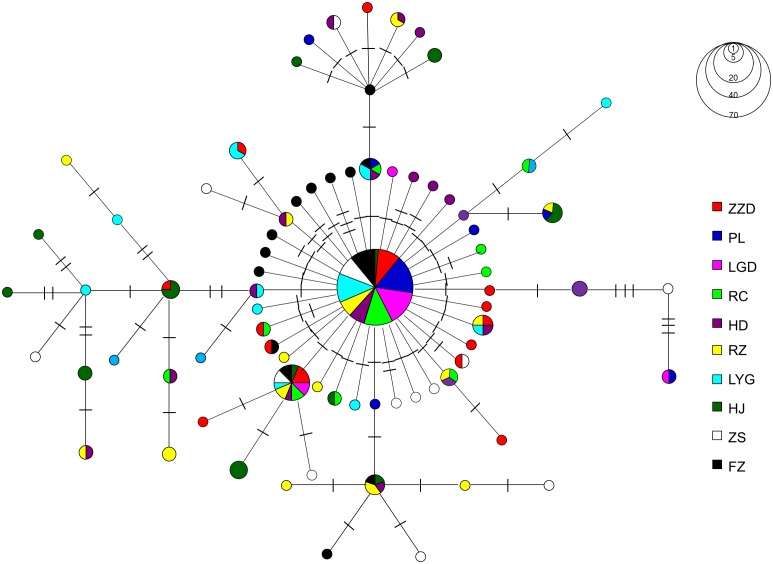
Figure 2. Minimum spanning tree showing genetic relationship among COI haplotypes in A. pectinata.
Circles represent haplotypes with sizes proportional to their respective frequencies. The population origins of haplotypes are indicated by colors. Tick marks represent deduced numbers of nucleotide substitutions along each branch.

