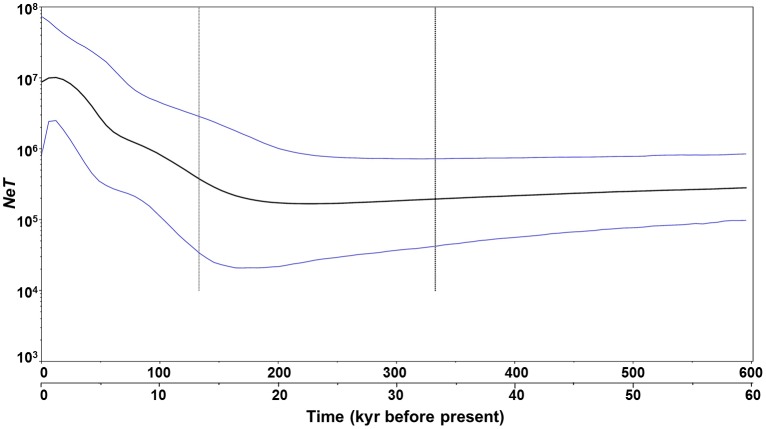
Figure 5. Demographic history of A. pectinata estimated using Bayesian skyline plots from COI sequences.
The figure shows changes of NeT (Ne = effective population size; T = generation time) through time. Shown at the bottom of the figure on a separate axis are times under an alternative (10×faster) calibration rate for COI gene. Black lines represent median estimates of NeT; light lines are the upper and lower 95% highest posterior density (HPD) limits of NeT; and the vertical light dashed line represents the median estimates of time to most recent common ancestor (TMRCA). The upper 95% HPD on TMRCA is at the right of the plot, whereas the lower 95% HPD is the black dashed line to the left of median. The y-axis is plotted on a logarithmic scale.

